Figures
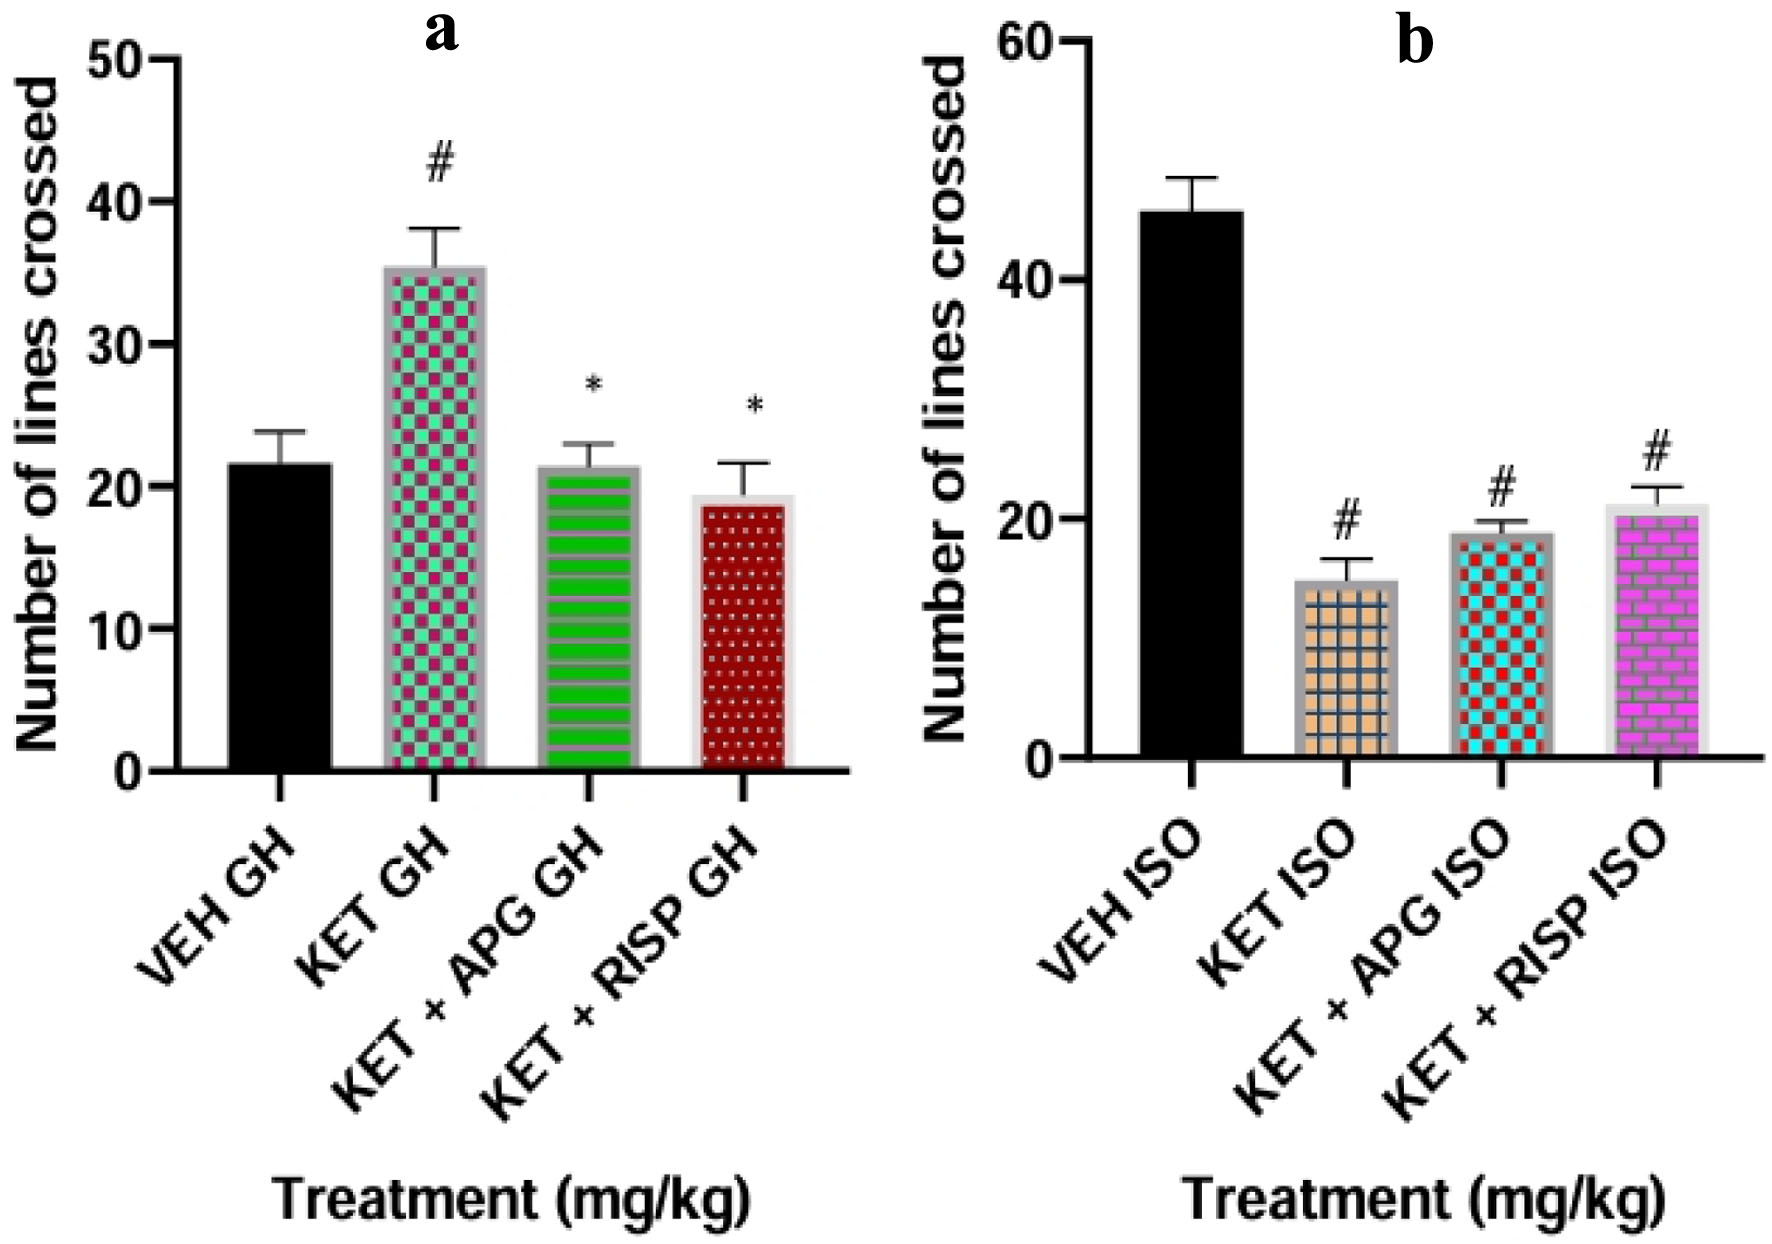
↓ Figure 1. Effect of APG on locomotor activity of weanling rats subjected to two-hit model of neurodevelopmental psychosis in OFT. (a) Group-housed animals. (b) Isolated-rearing animals. Bar represents the mean ± SEM of eight animals. *P < 0.05 as compared with KET GH/KET ISO followed by ANOVA and Tukey’s post hoc test for multiple comparisons. #P < 0.05 as compared with VEH GH/VEH ISO followed by ANOVA and Tukey’s post hoc test for multiple comparisons. APG: apigenin; ANOVA: analysis of variance; GH: group-housed; ISO: isolated; KET: ketamine; OFT: open field test; RISP: risperidone; SEM: standard error of the mean; VEH: vehicle.
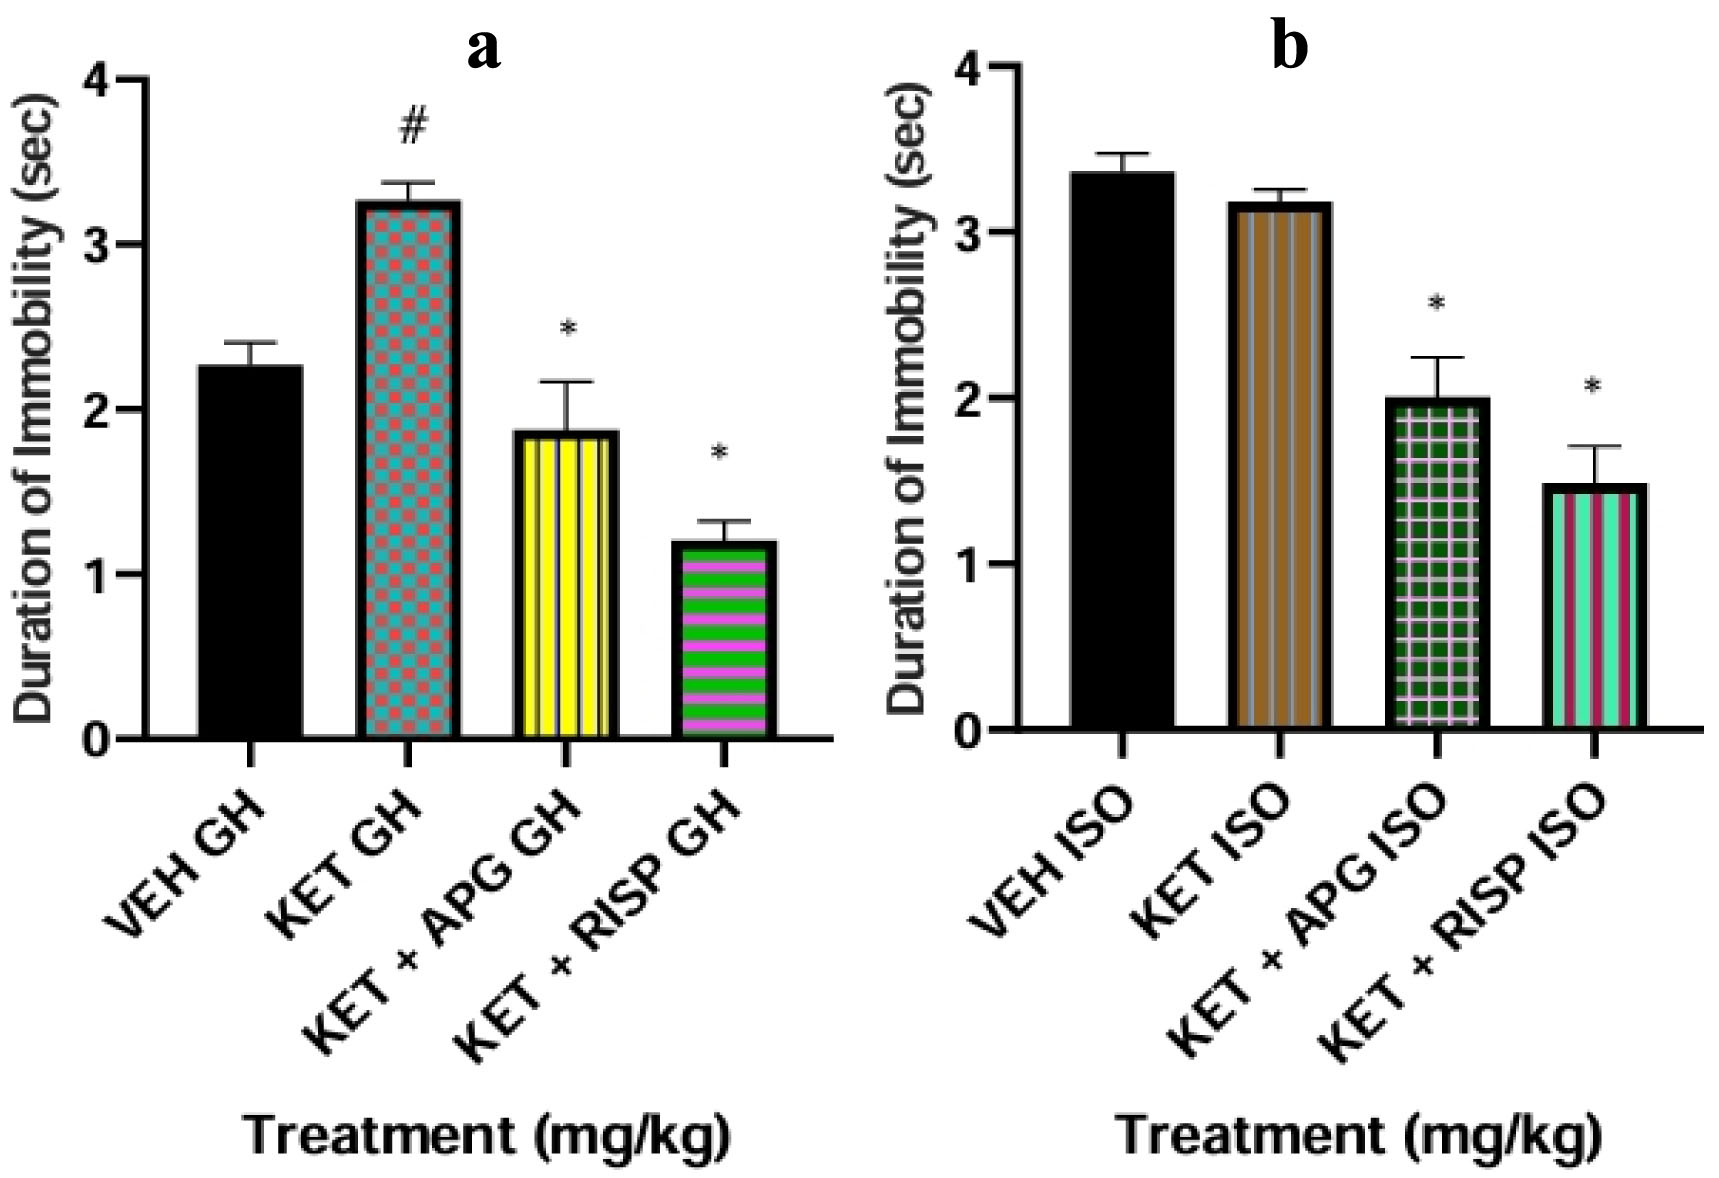
↓ Figure 2. Effect of APG on immobility in weanling rats subjected to two-hit model of neurodevelopmental psychosis in FST. (a) Group-housed animals. (b) Isolated-rearing animals. Bar represents the mean ± SEM of eight animals. *P < 0.05 as compared with KET GH/KET ISO followed by ANOVA and Tukey’s post hoc test for multiple comparisons. #P < 0.05 as compared with VEH GH/VEH ISO followed by ANOVA and Tukey’s post hoc test for multiple comparisons. APG: apigenin; ANOVA: analysis of variance; FST: forced swim test; GH: group-housed; ISO: isolated; KET: ketamine; RISP: risperidone; SEM: standard error of the mean; VEH: vehicle.
↓ Figure 3. Effect of APG on reduced GSH level in amygdala of weanling rats in two-hit model of neurodevelopmental psychosis. (a) Group-housed animals. (b) Isolated-rearing animals. Bar represents the mean ± SEM of eight animals. *P < 0.05 as compared with KET GH/KET ISO followed by ANOVA and Tukey’s post hoc test for multiple comparisons. #P < 0.05 as compared with VEH GH/VEH ISO followed by ANOVA and Tukey’s post hoc test for multiple comparisons. APG: apigenin; ANOVA: analysis of variance; GH: group-housed; GSH: reduced glutathione; ISO: isolated; KET: ketamine; RISP: risperidone; SEM: standard error of the mean; VEH: vehicle.
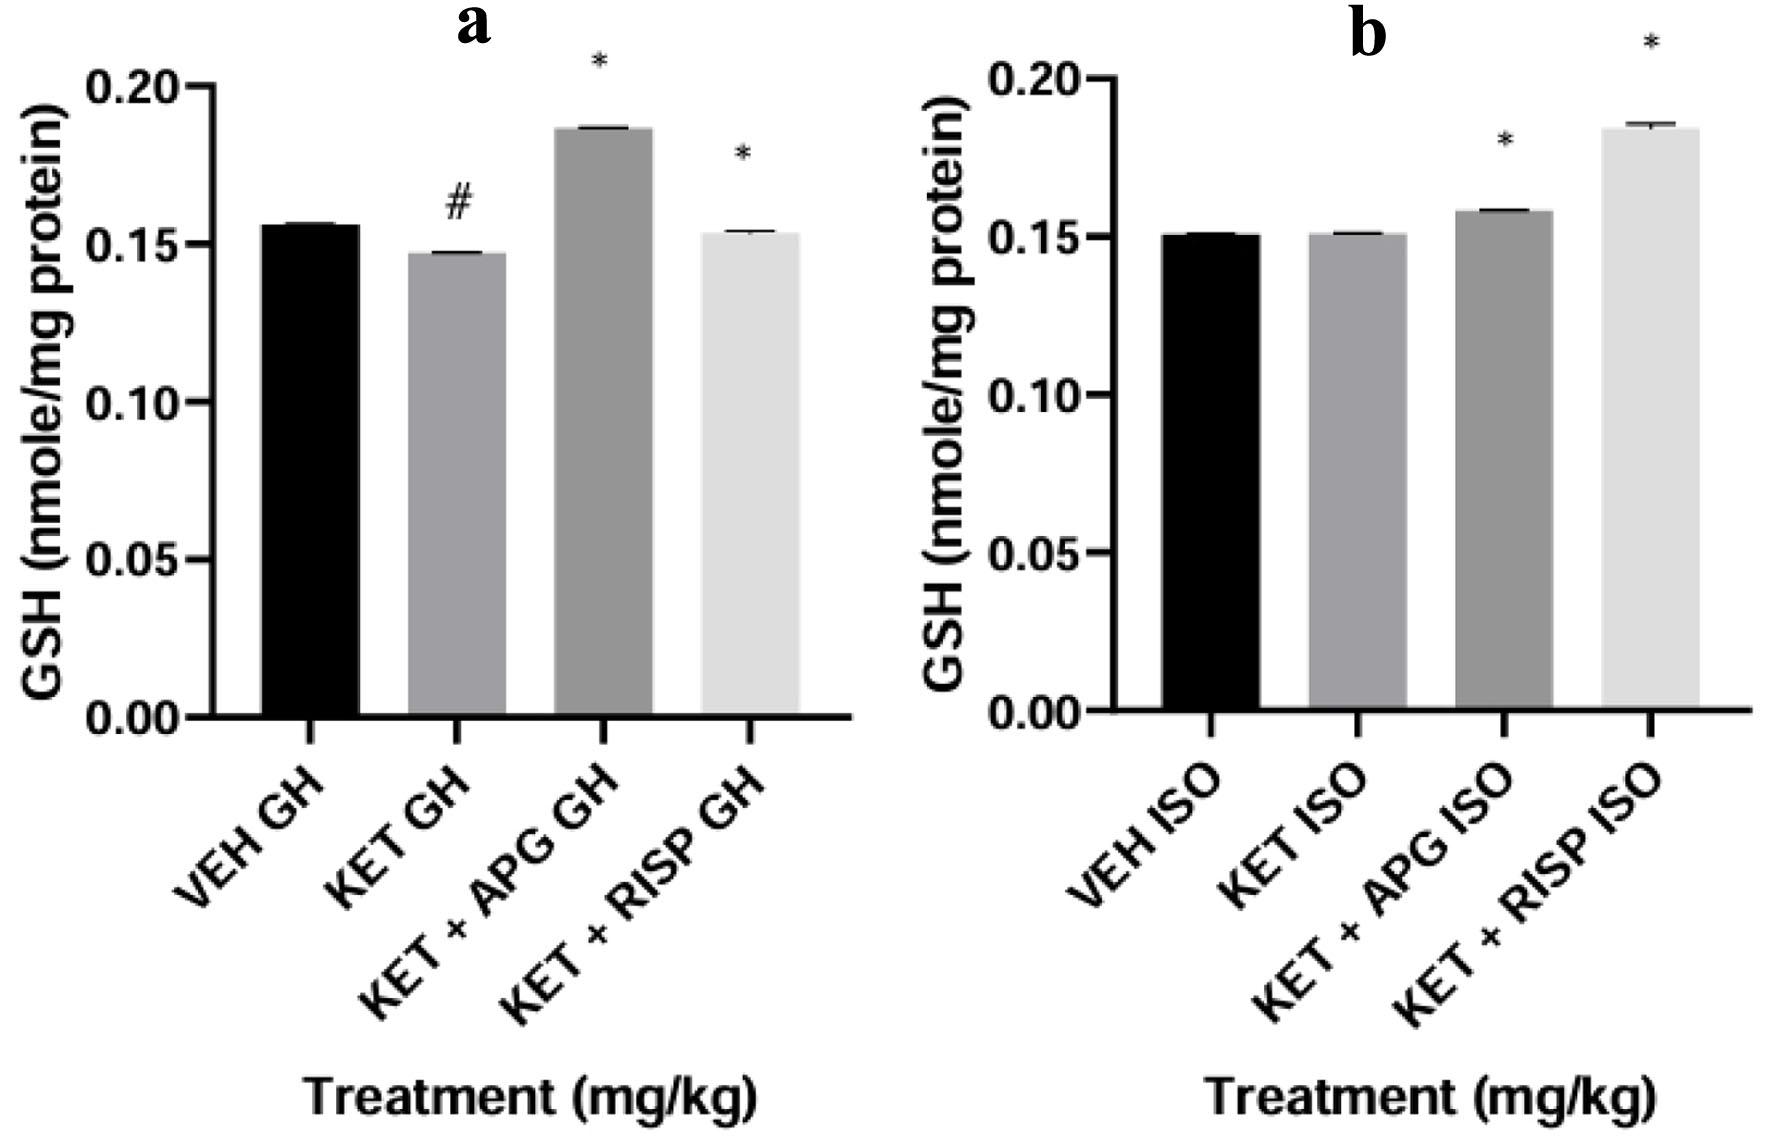
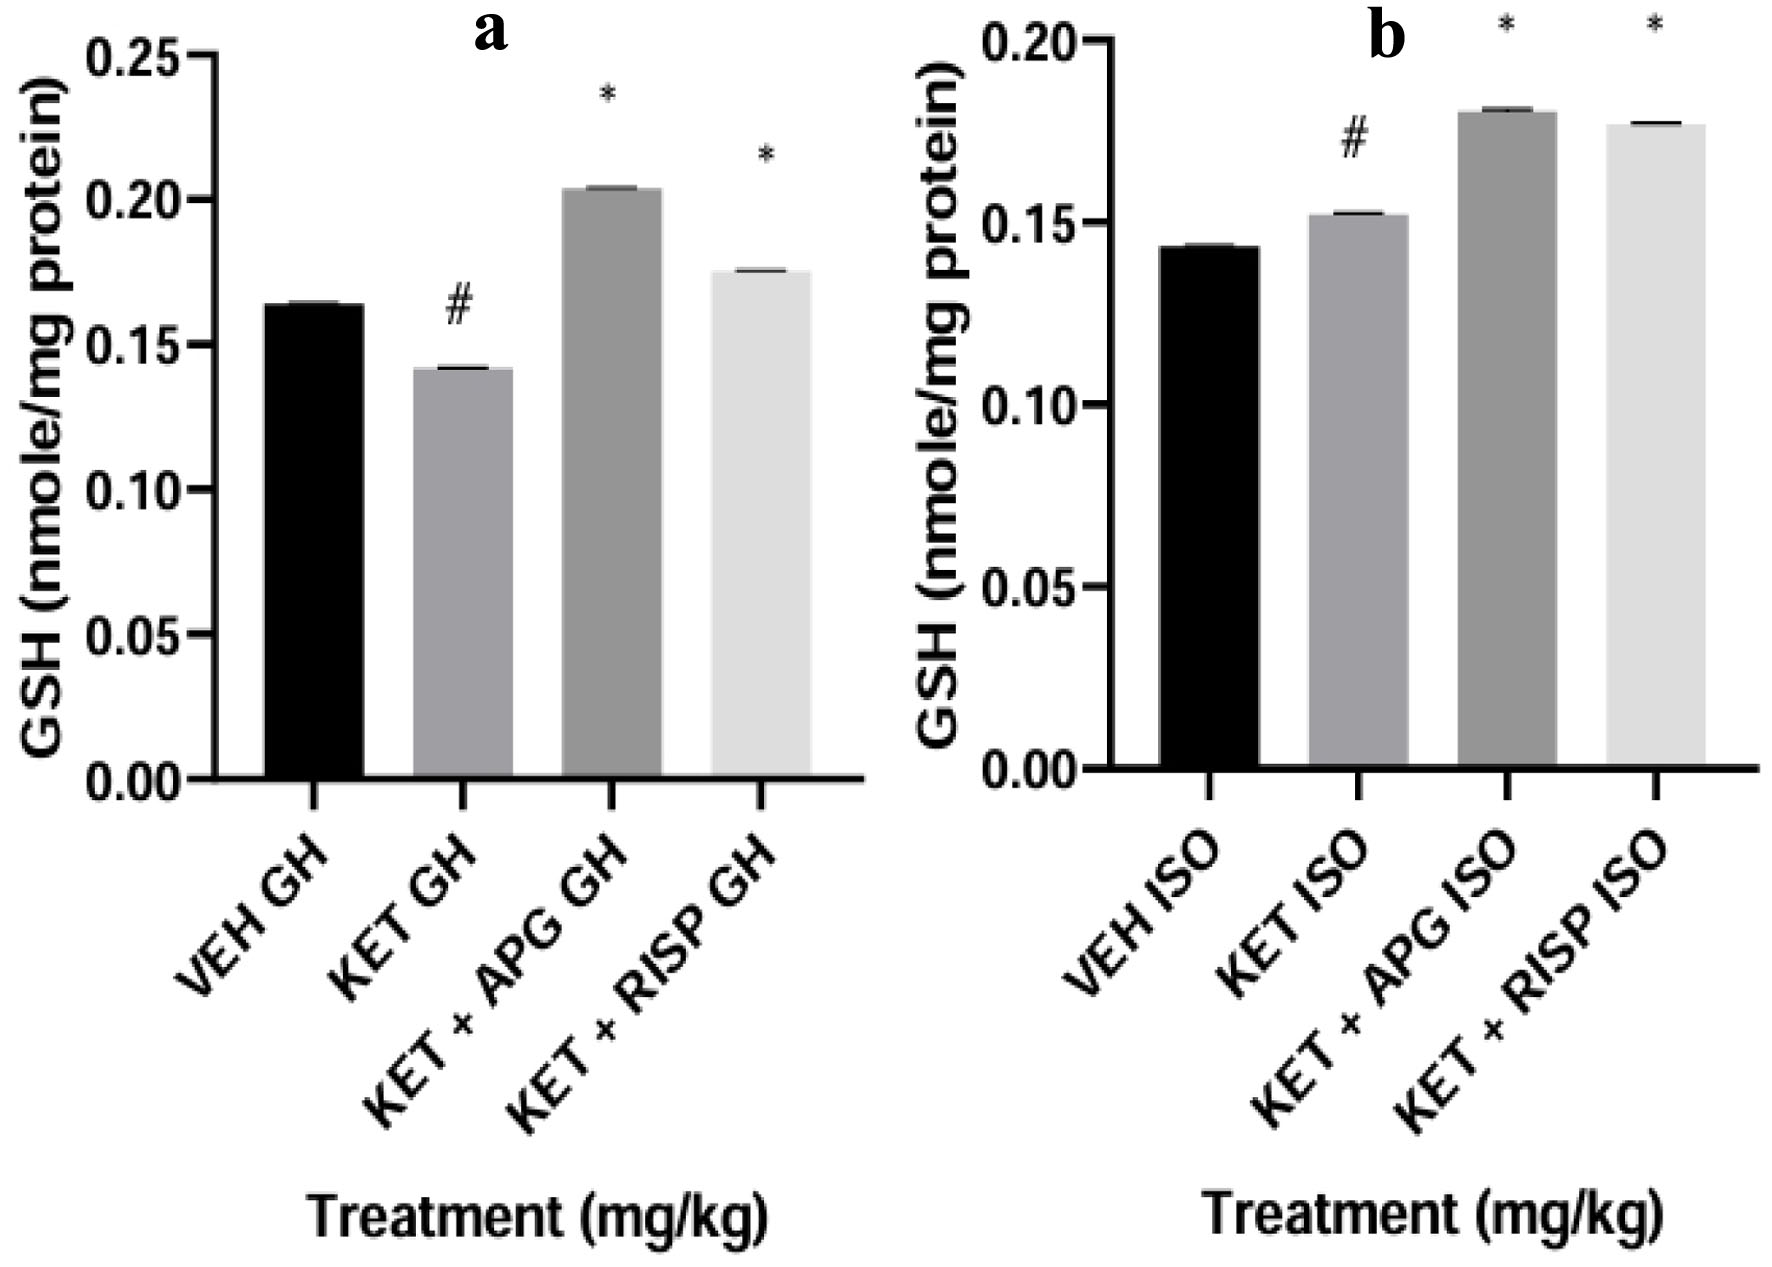
↓ Figure 4. Effect of APG on GSH level in hippocampus of weanling rats subjected to two-hit model of neurodevelopmental psychosis. (a) Group-housed animals. (b) Isolated-rearing animals. Bar represents the mean ± SEM of eight animals. *P < 0.05 as compared with KET GH/KET ISO followed by ANOVA and Tukey’s post hoc test for multiple comparisons. #P < 0.05 as compared with VEH GH/VEH ISO followed by ANOVA and Tukey’s post hoc test for multiple comparisons. APG: apigenin; ANOVA: analysis of variance; GH: group-housed; GSH: reduced glutathione; ISO: isolated; KET: ketamine; RISP: risperidone; SEM: standard error of the mean; VEH: vehicle.
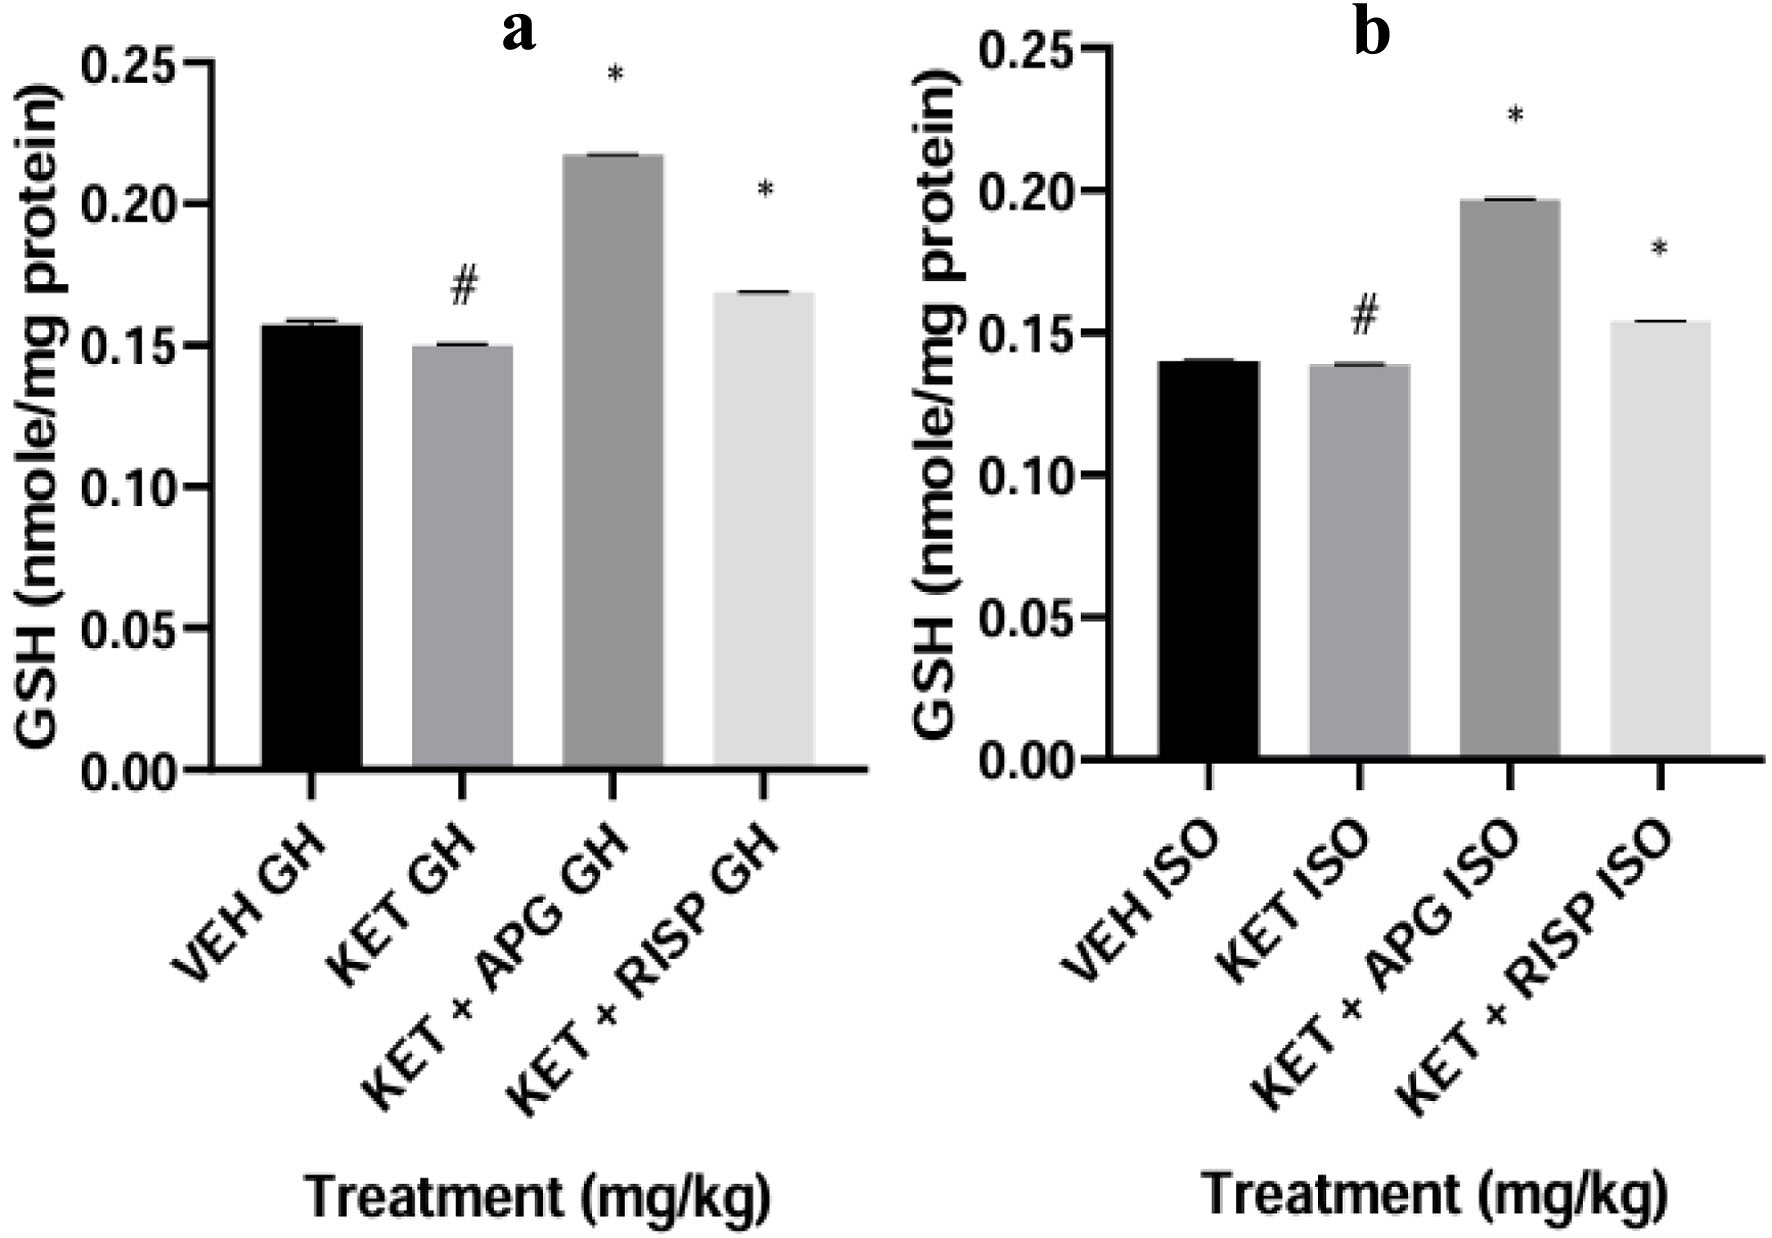
↓ Figure 5. Effect of APG on GSH level in Prefrontal cortex of weanling rats subjected to two-hit model of neurodevelopmental psychosis. (a) Group-housed animals. (b) Isolated-rearing animals. Bar represents the mean ± SEM of eight animals. *P < 0.05 as compared with KET GH/KET ISO followed by ANOVA and Tukey’s post hoc test for multiple comparisons. #P < 0.05 as compared with VEH GH/VEH ISO followed by ANOVA and Tukey’s post hoc test for multiple comparisons. APG: apigenin; ANOVA: analysis of variance; GH: group-housed; GSH: reduced glutathione; ISO: isolated; KET: ketamine; RISP: risperidone; SEM: standard error of the mean; VEH: vehicle.
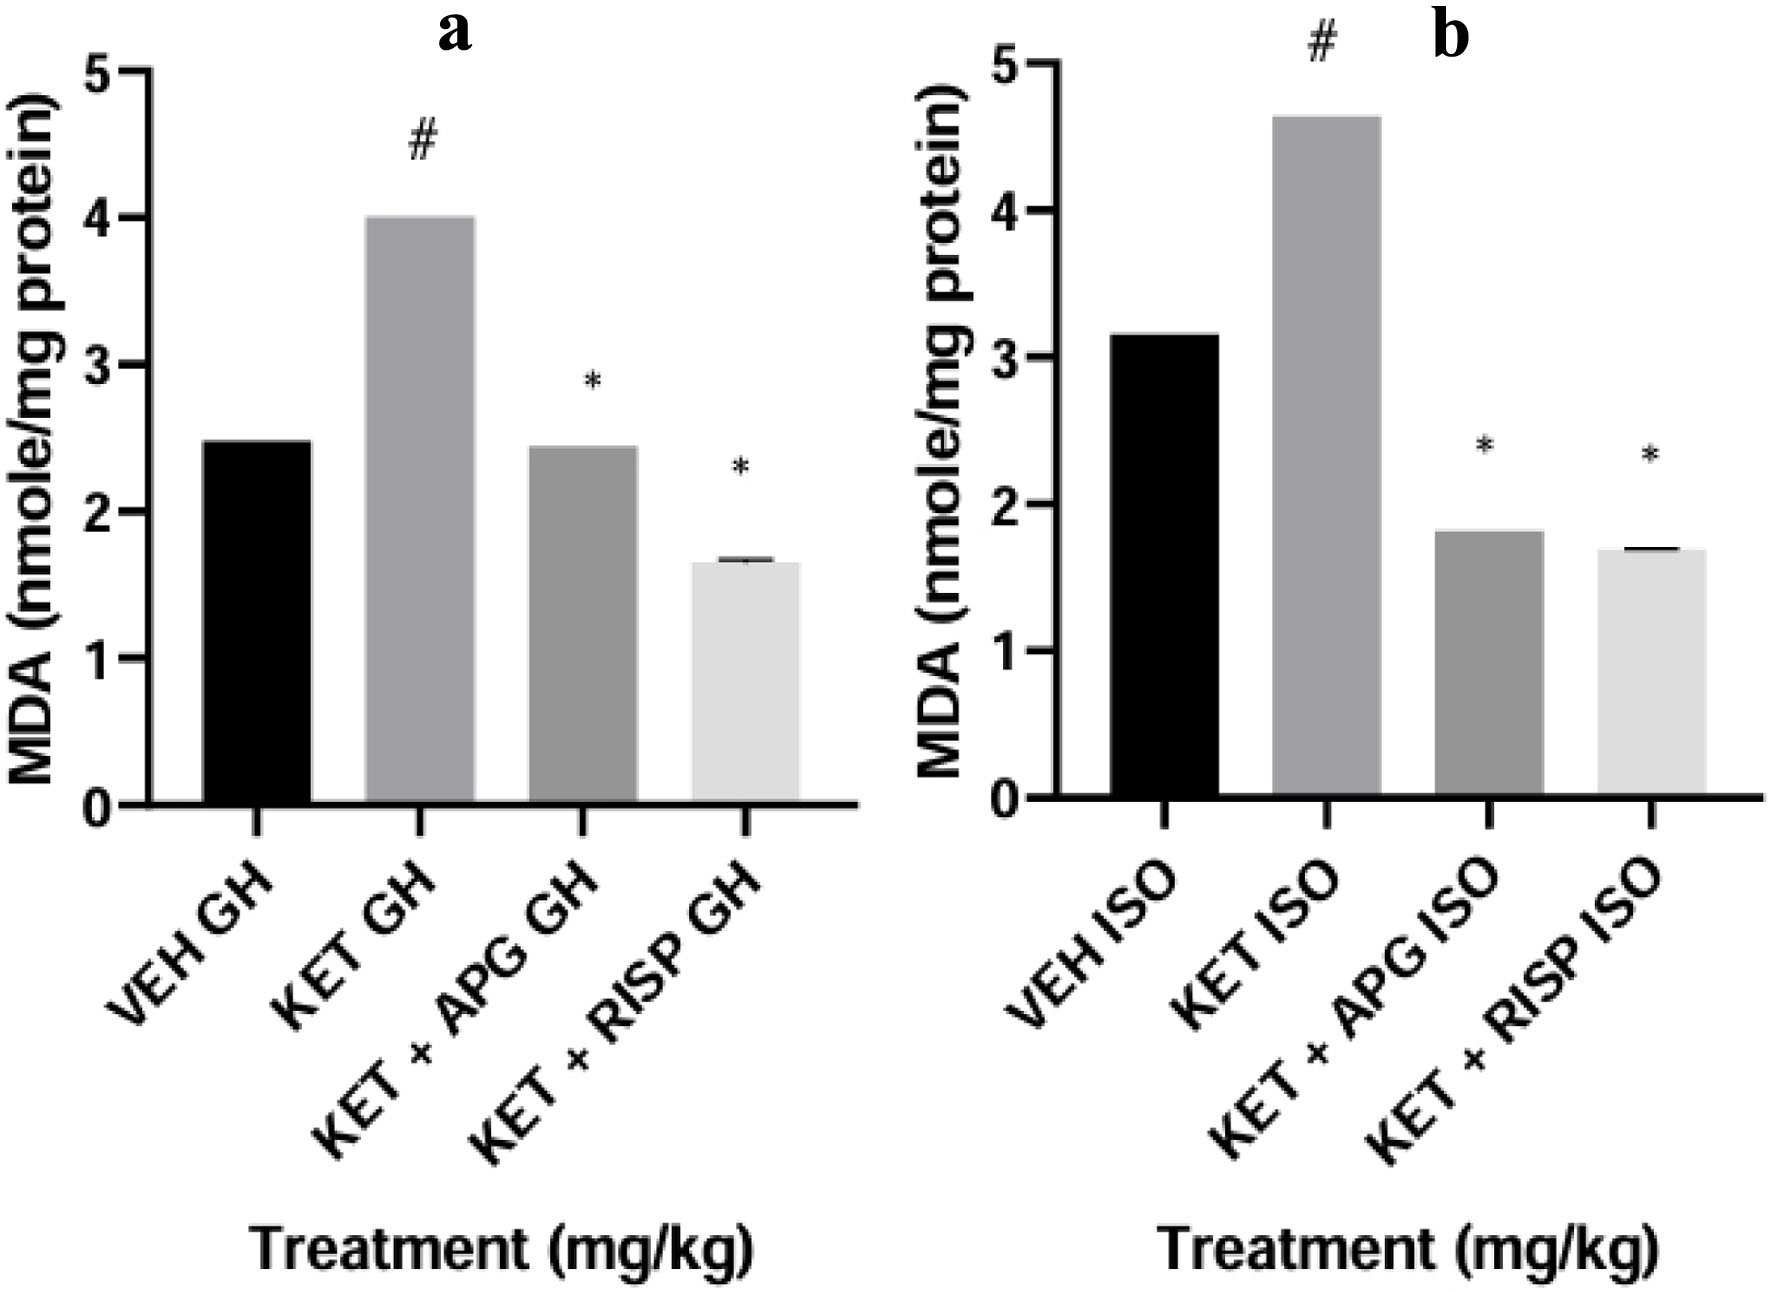
↓ Figure 6. Effect of APG on MDA level in amygdala of weanling rats subjected to two-hit model of neurodevelopmental psychosis. (a) Group-housed animals. (b) Isolated-rearing animals. Bar represents the mean ± SEM of eight animals. *P < 0.05 as compared with KET GH/KET ISO followed by ANOVA and Tukey’s post hoc test for multiple comparisons. #P < 0.05 as compared with VEH GH/VEH ISO followed by ANOVA and Tukey’s post hoc test for multiple comparisons. APG: apigenin; ANOVA: analysis of variance; GH: group-housed; ISO: isolated; KET: ketamine; MDA: malondialdehyde; RISP: risperidone; SEM: standard error of the mean; VEH: vehicle.
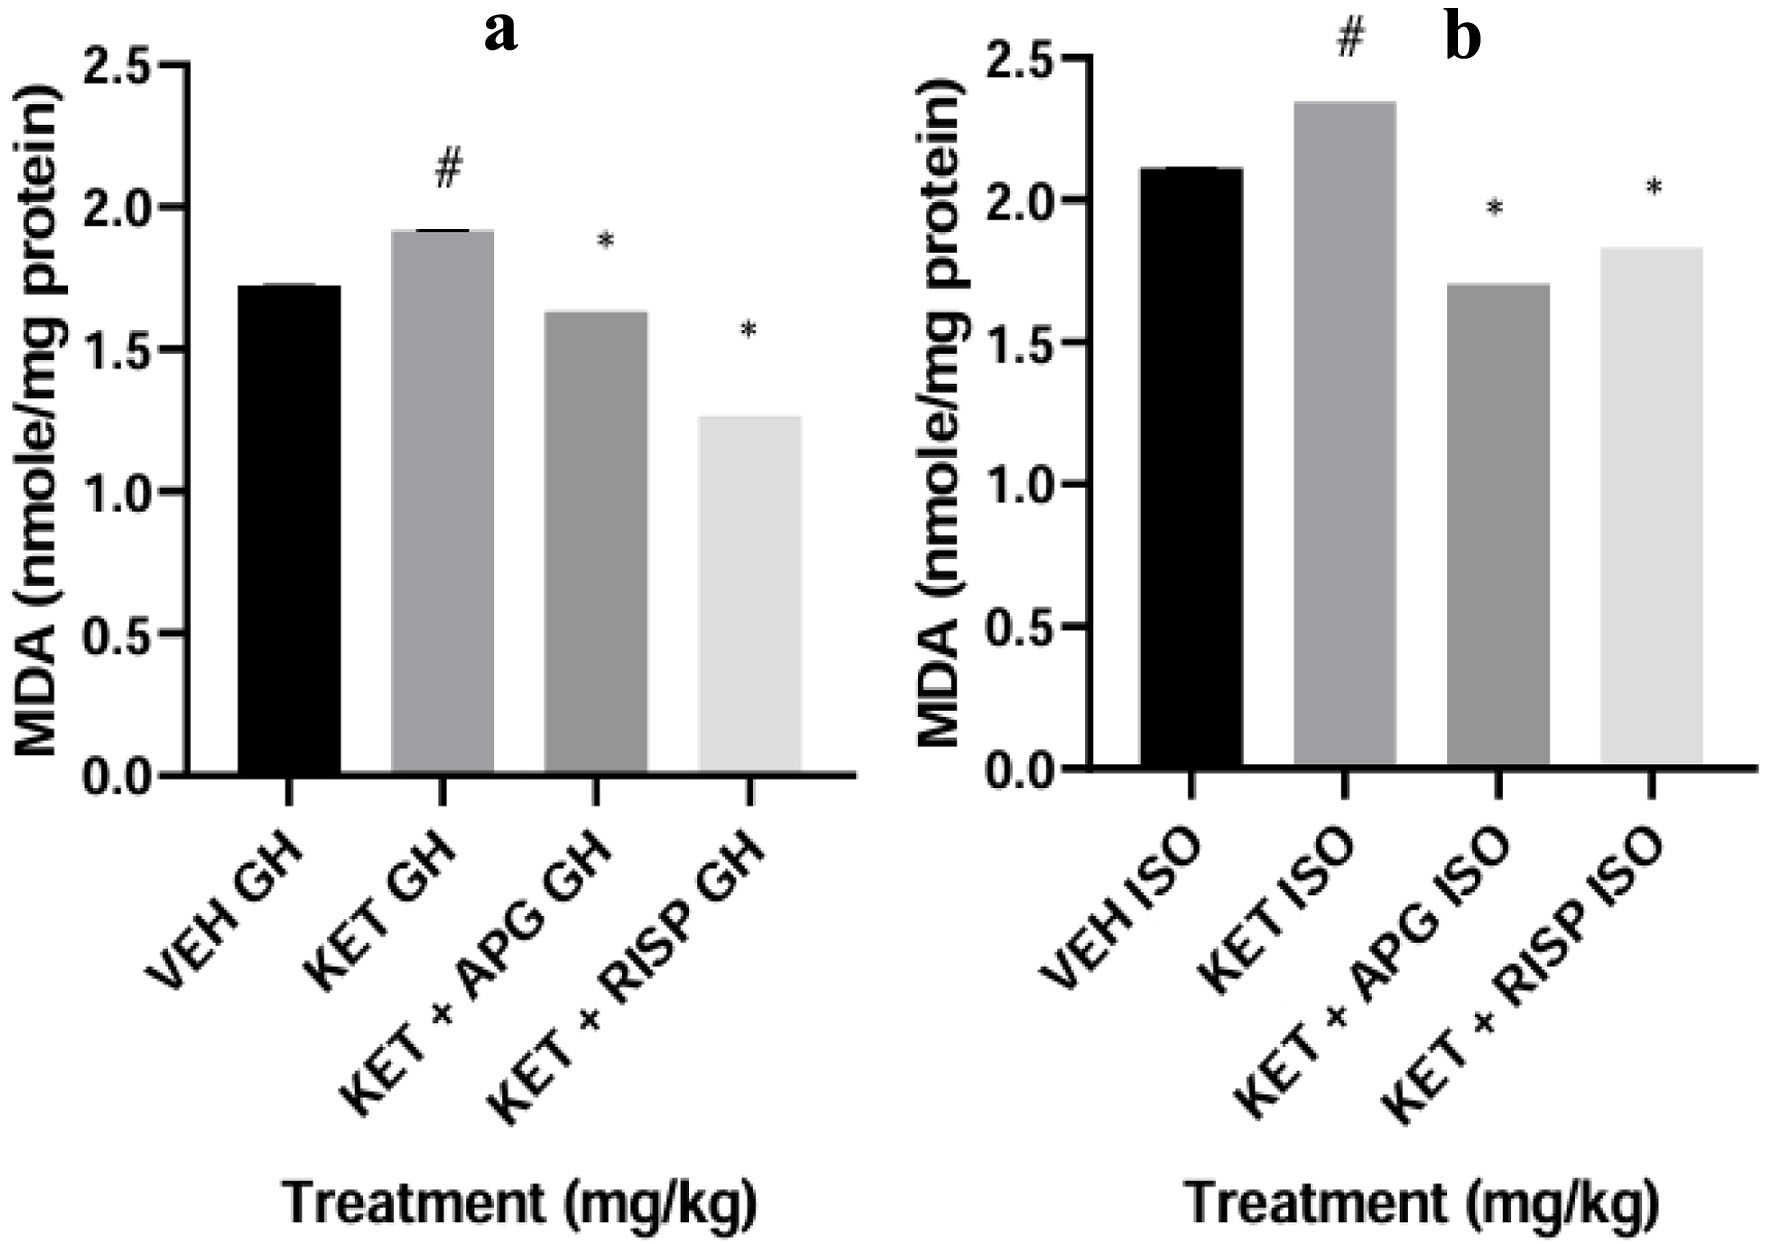
↓ Figure 7. Effect of APG on MDA level in hippocampus of weanling rats subjected to two-hit model of neurodevelopmental psychosis. (a) Group-housed animals. (b) Isolated-rearing animals. Bar represents the mean ± SEM of eight animals. *P < 0.05 as compared with KET GH/KET ISO followed by ANOVA and Tukey’s post hoc test for multiple comparisons. #P < 0.05 as compared with VEH GH/VEH ISO followed by ANOVA and Tukey’s post hoc test for multiple comparisons. APG: apigenin; ANOVA: analysis of variance; GH: group-housed; ISO: isolated; KET: ketamine; MDA: malondialdehyde; RISP: risperidone; SEM: standard error of the mean; VEH: vehicle.
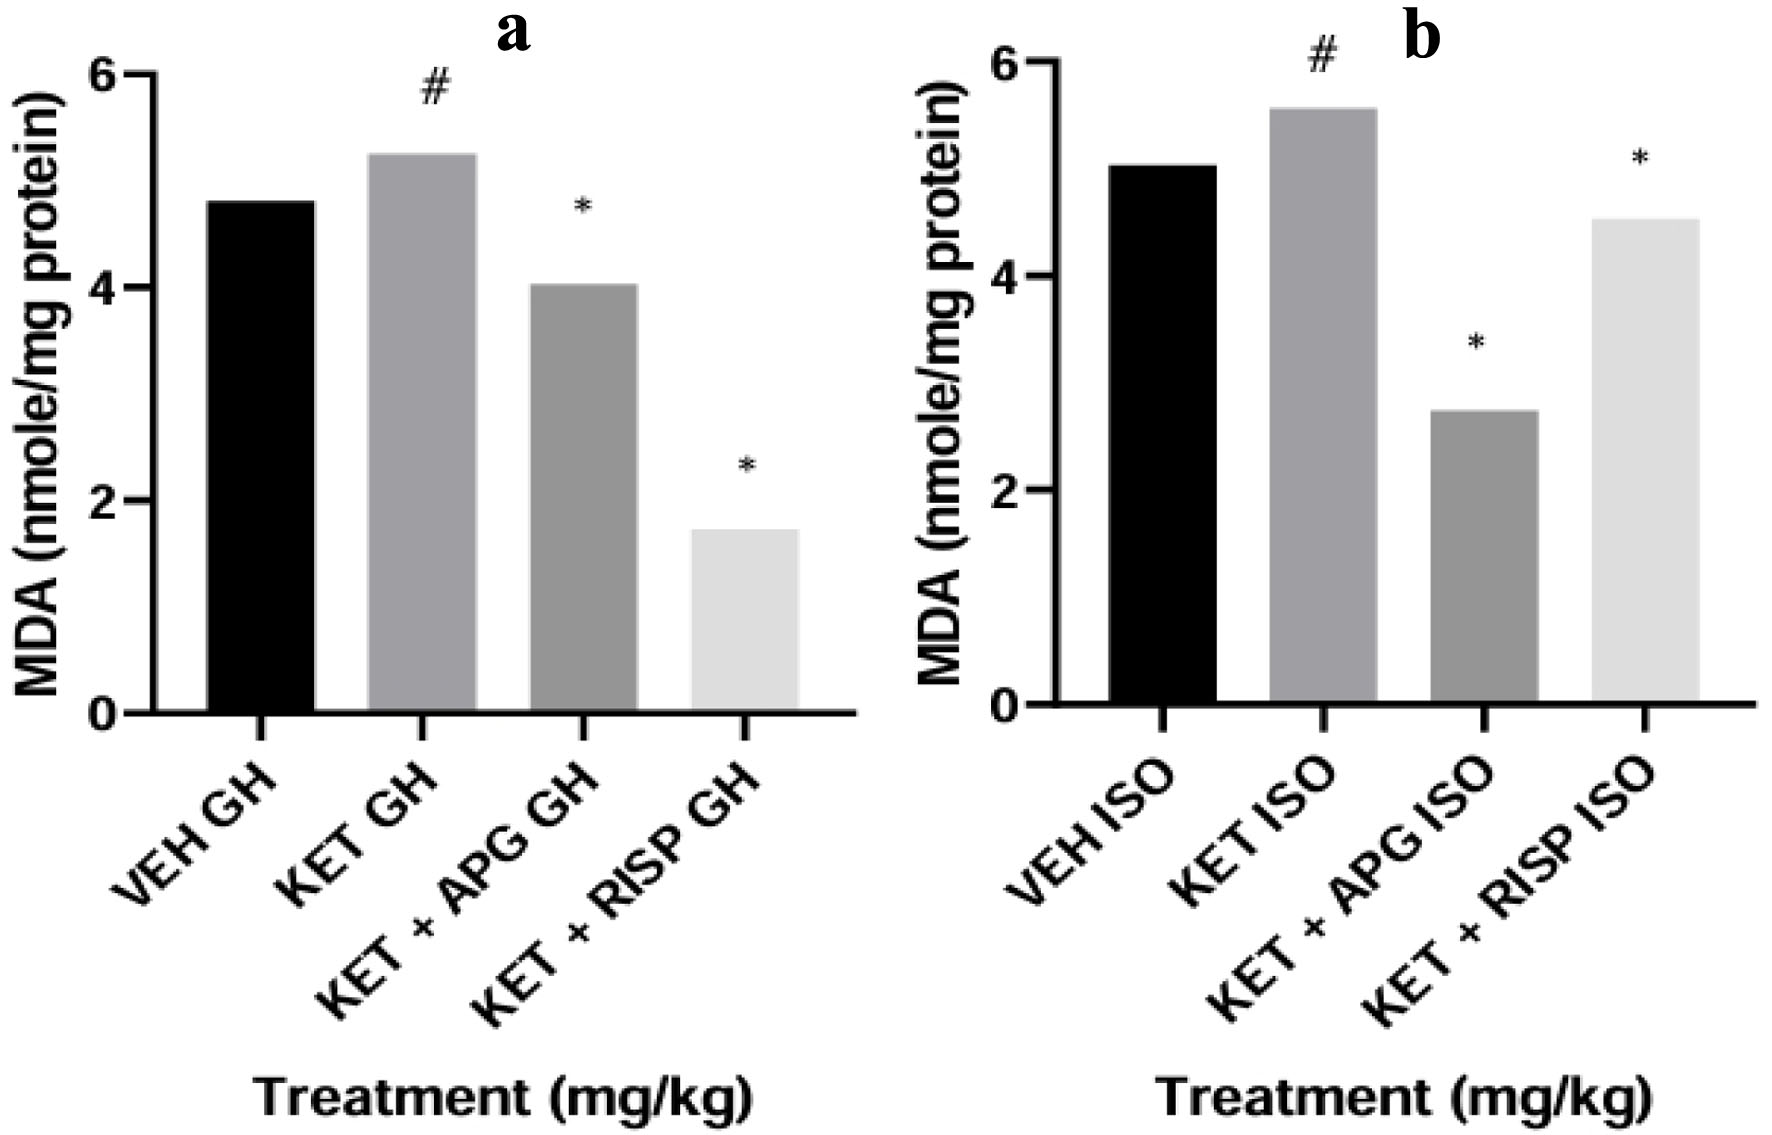
↓ Figure 8. Effect of APG on MDA level in prefrontal cortex of weanling rats subjected to two-hit model of neurodevelopmental psychosis. (a) Group-housed animals. (b) Isolated-rearing animals. Bar represents the mean ± SEM of eight animals. *P < 0.05 as compared with KET GH/KET ISO followed by ANOVA and Tukey’s post hoc test for multiple comparisons. #P < 0.05 as compared with VEH GH/VEH ISO followed by ANOVA and Tukey’s post hoc test for multiple comparisons. APG: apigenin; ANOVA: analysis of variance; GH: group-housed; ISO: isolated; KET: ketamine; MDA: malondialdehyde; RISP: risperidone; SEM: standard error of the mean; VEH: vehicle.
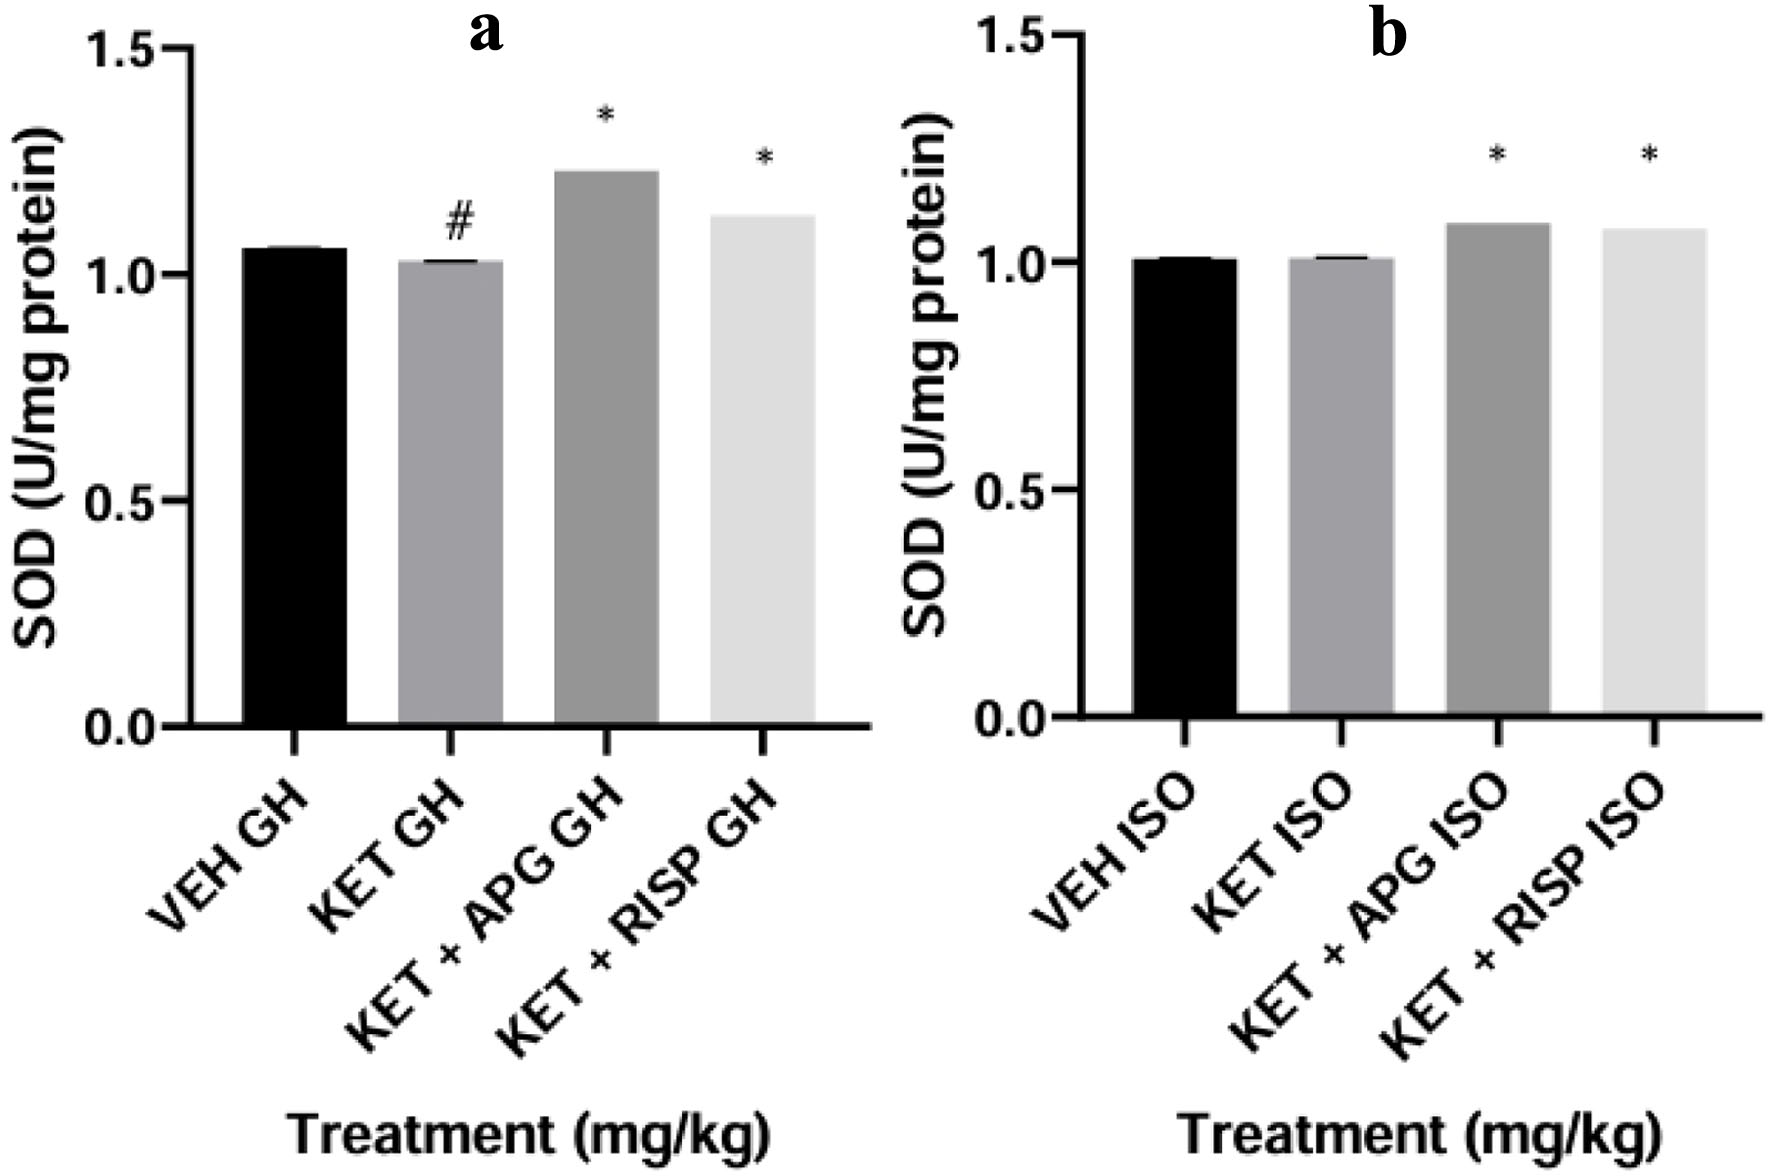
↓ Figure 9. Effect of APG on SOD level in amygdala of weanling rats subjected to two-hit model of neurodevelopmental psychosis. (a) Group-housed animals. (b) Isolated-rearing animals. Bar represents the mean ± SEM of eight animals. *P < 0.05 as compared with KET GH/KET ISO followed by ANOVA and Tukey’s post hoc test for multiple comparisons. #P < 0.05 as compared with VEH GH/VEH ISO followed by ANOVA and Tukey’s post hoc test for multiple comparisons. APG: apigenin; ANOVA: analysis of variance; GH: group-housed; ISO: isolated; KET: ketamine; RISP: risperidone; SEM: standard error of the mean; SOD: superoxide dismutase; VEH: vehicle.
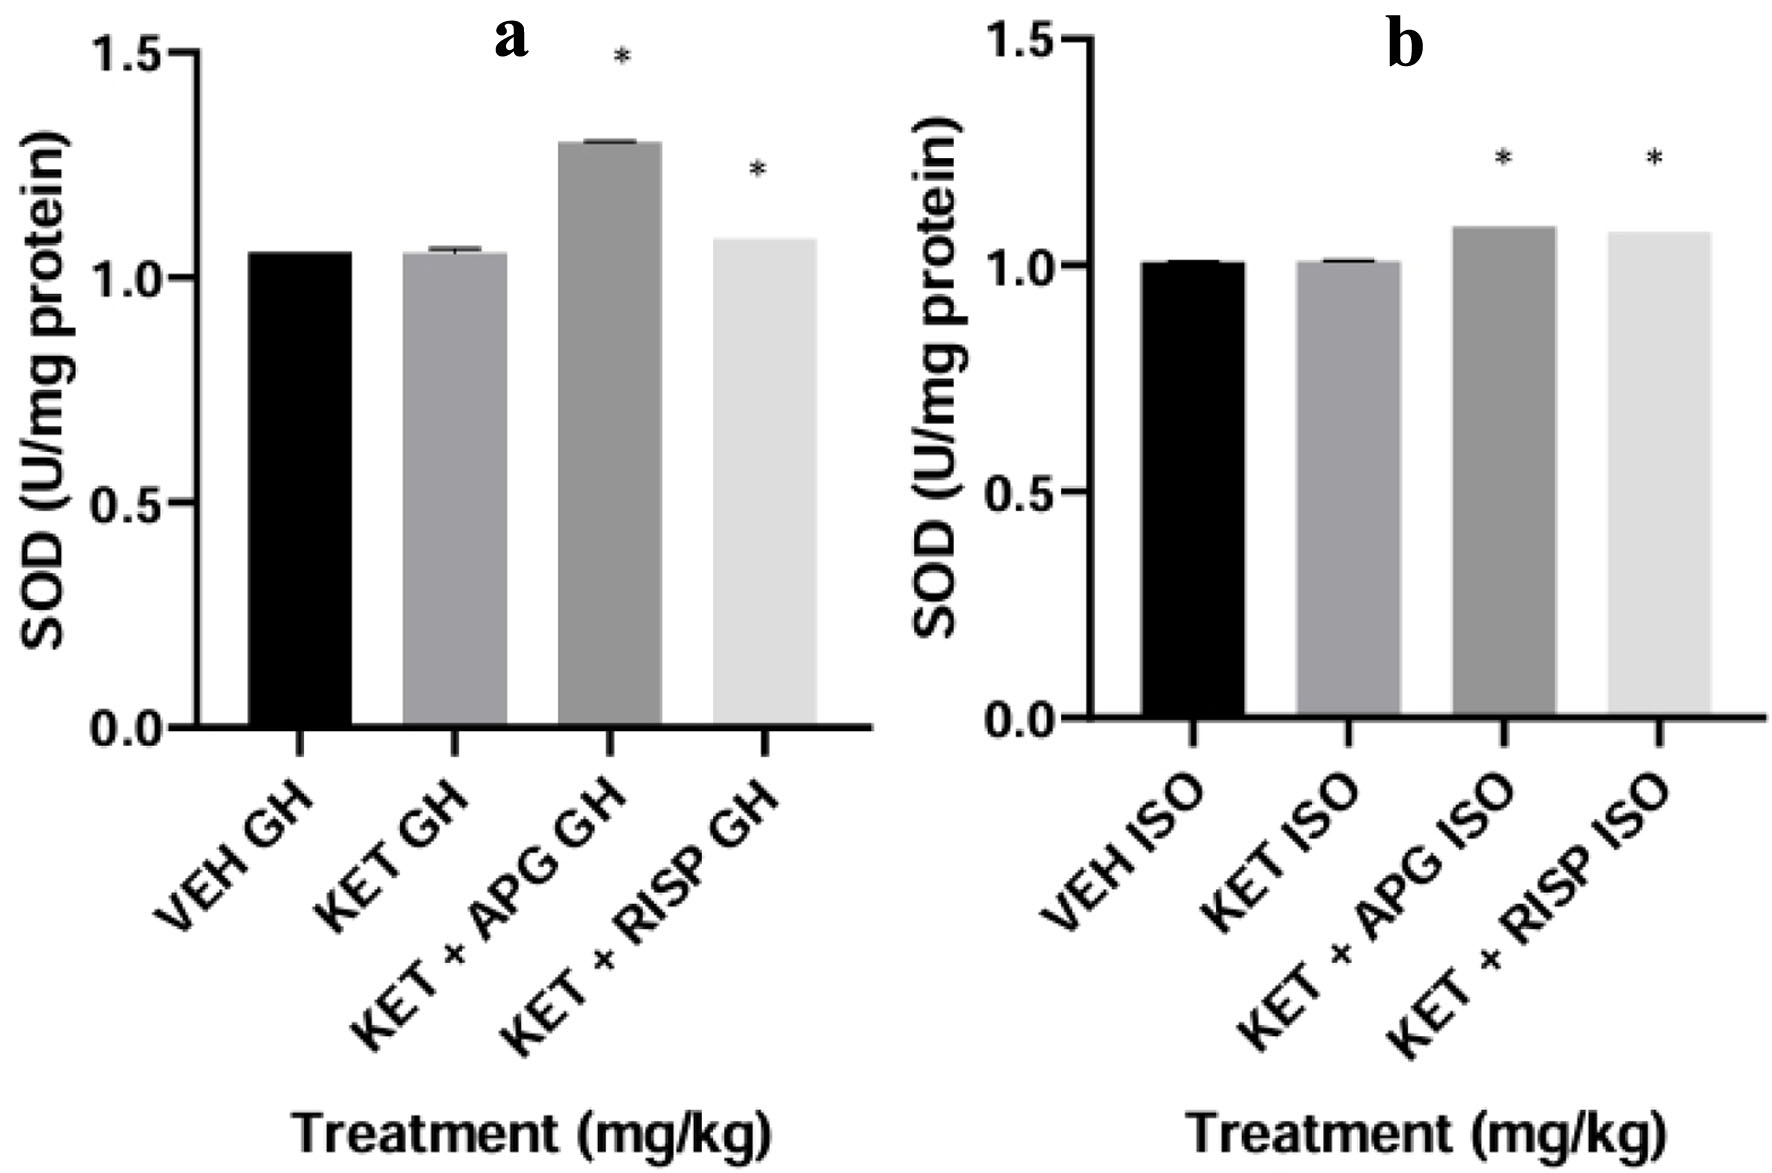
↓ Figure 10. Effect of APG on SOD level in hippocampus of weanling rats subjected to two-hit model of neurodevelopmental psychosis. (a) Group-housed animals. (b) Isolated-rearing animals. Bar represents the mean ± SEM of eight animals. *P < 0.05 as compared with KET GH/KET ISO followed by ANOVA and Tukey’s post hoc test for multiple comparisons. #P < 0.05 as compared with VEH GH/VEH ISO followed by ANOVA and Tukey’s post hoc test for multiple comparisons. APG: apigenin; ANOVA: analysis of variance; GH: group-housed; ISO: isolated; KET: ketamine; RISP: risperidone; SEM: standard error of the mean; SOD: superoxide dismutase; VEH: vehicle.
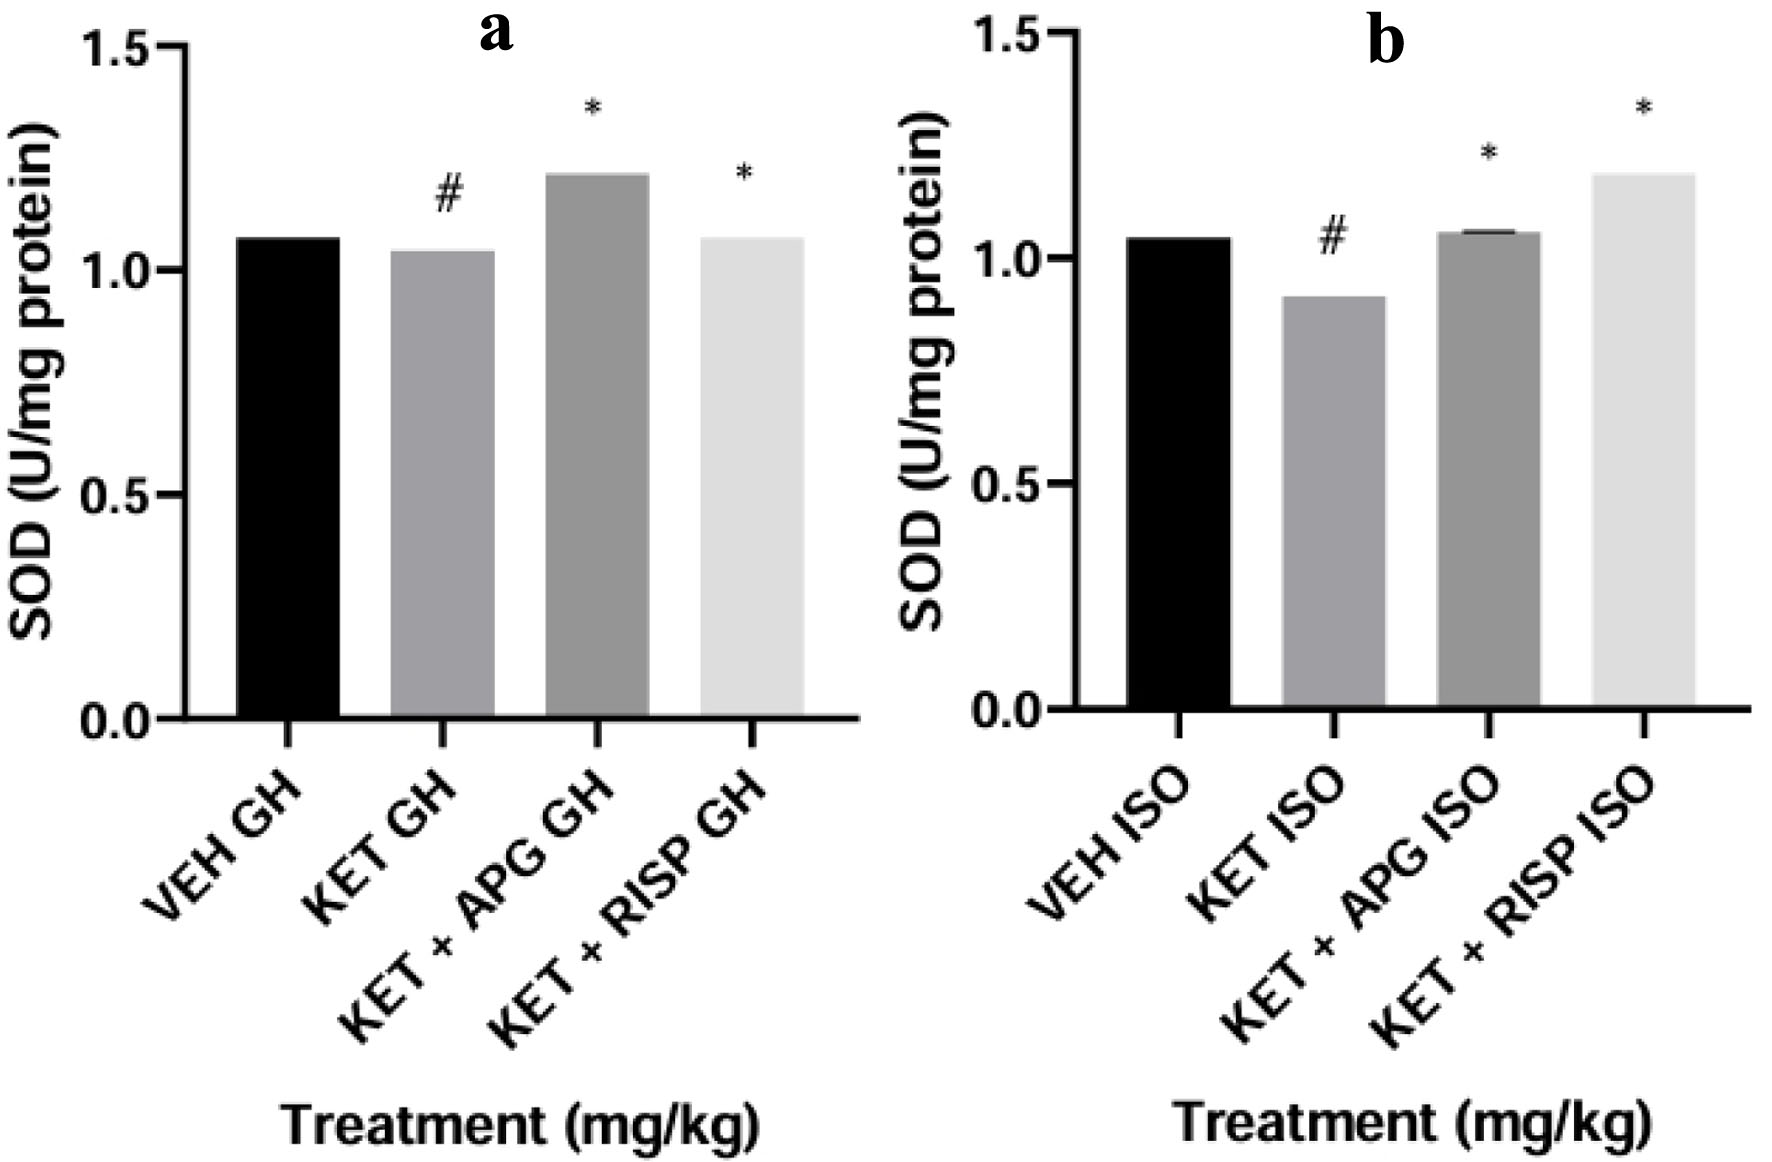
↓ Figure 11. Effect of APG on SOD level in Prefrontal cortex of weanling rats subjected to two-hit model of neurodevelopmental psychosis. (a) Group-housed animals. (b) Isolated-rearing animals. Bar represents the mean ± SEM of eight animals. *P < 0.05 as compared with KET GH/KET ISO followed by ANOVA and Tukey’s post hoc test for multiple comparisons. #P < 0.05 as compared with VEH GH/VEH ISO followed by ANOVA and Tukey’s post hoc test for multiple comparisons. APG: apigenin; ANOVA: analysis of variance; GH: group-housed; ISO: isolated; KET: ketamine; RISP: risperidone; SEM: standard error of the mean; SOD: superoxide dismutase; VEH: vehicle.
↓ Figure 12. Effect of APG on nitrite level in amygdala of weanling rats subjected to two-hit model of neurodevelopmental psychosis. (a) Group-housed animals. (b) Isolated-rearing animals. Bar represents the mean ± SEM of eight animals. *P < 0.05 as compared with KET GH/KET ISO followed by ANOVA and Tukey’s post hoc test for multiple comparisons. #P < 0.05 as compared with VEH GH/VEH ISO followed by ANOVA and Tukey’s post hoc test for multiple comparisons. APG: apigenin; ANOVA: analysis of variance; GH: group-housed; ISO: isolated; KET: ketamine; RISP: risperidone; SEM: standard error of the mean; VEH: vehicle.
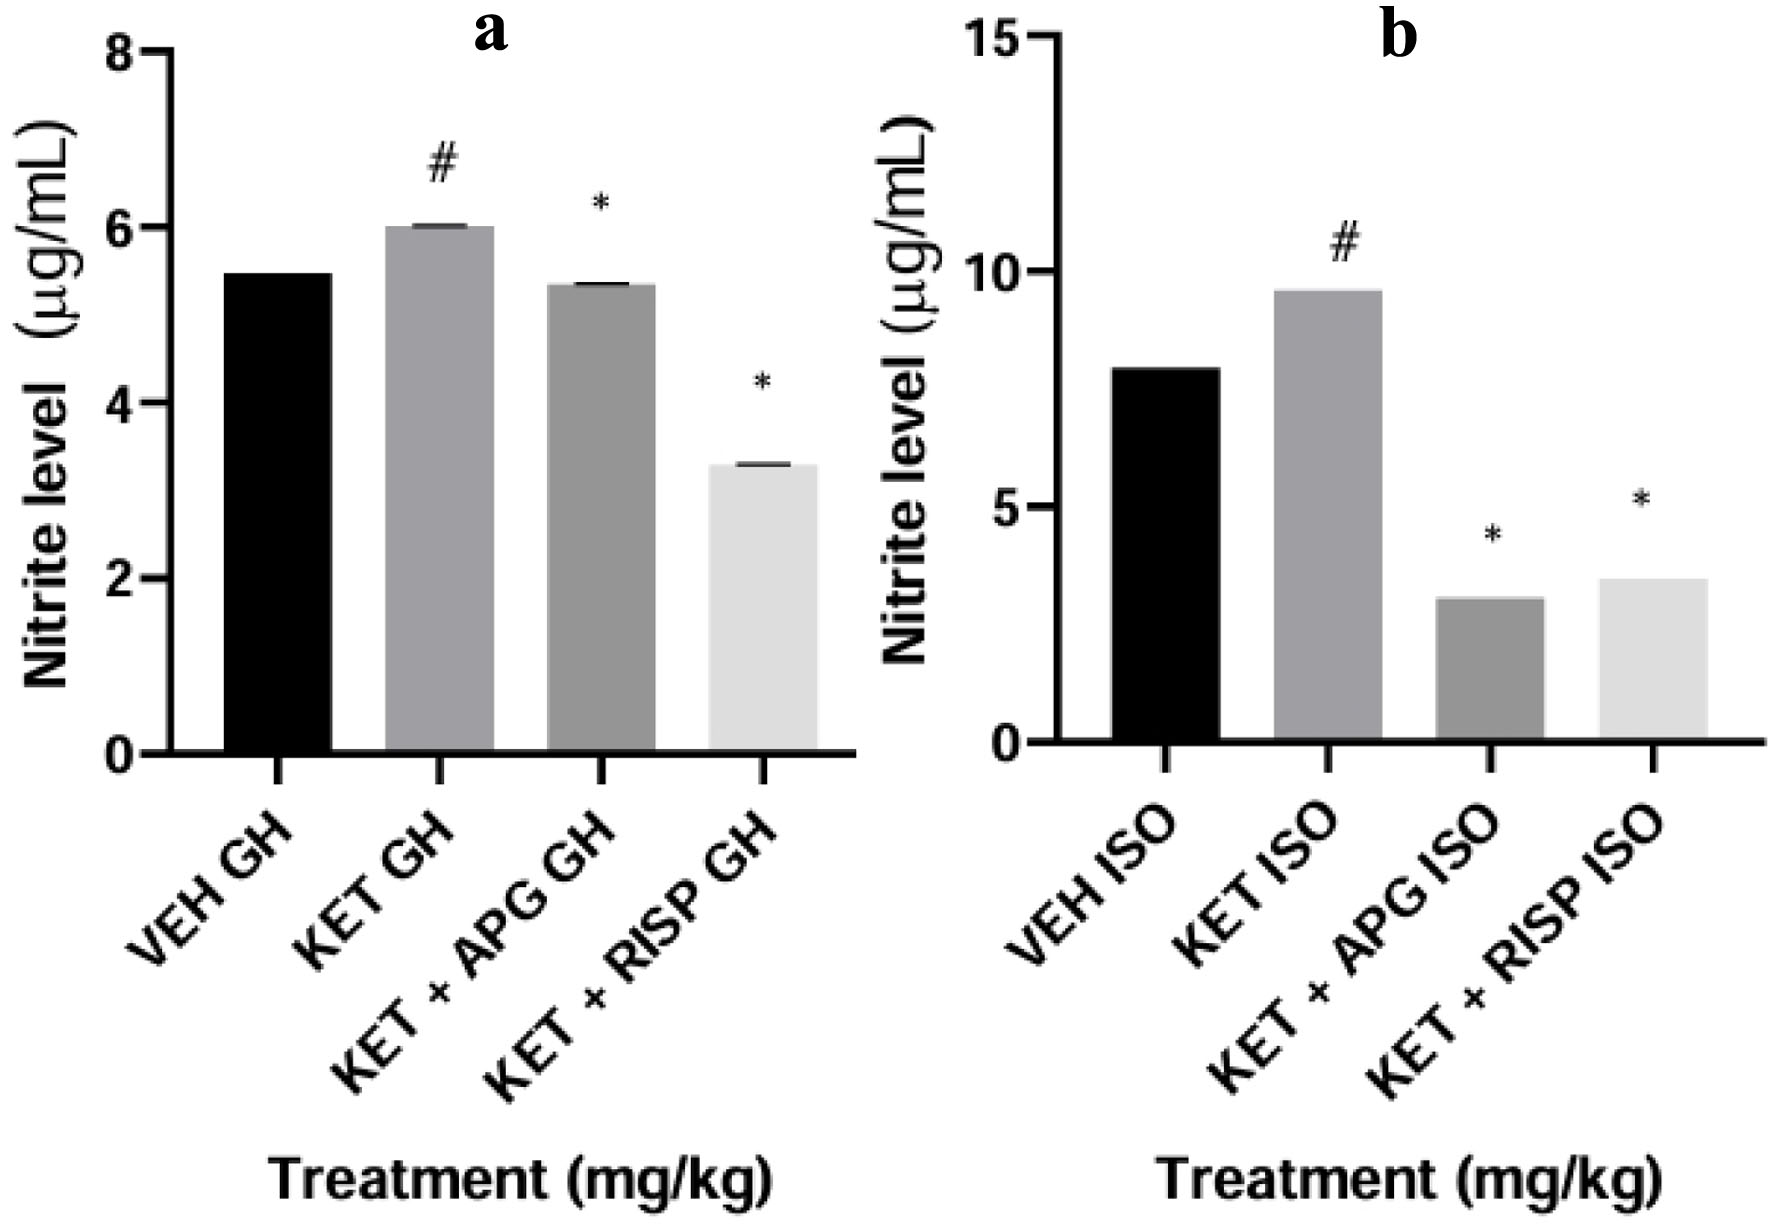
↓ Figure 13. Effect of APG on nitrite level in hippocampus of weanling rats subjected to two-hit model of neurodevelopmental psychosis. (a) Group-housed animals. (b) Isolated-rearing animals. Bar represents the mean ± SEM of eight animals. *P < 0.05 as compared with KET GH/KET ISO followed by ANOVA and Tukey’s post hoc test for multiple comparisons. #P < 0.05 as compared with VEH GH/VEH ISO followed by ANOVA and Tukey’s post hoc test for multiple comparisons. APG: apigenin; ANOVA: analysis of variance; GH: group-housed; ISO: isolated; KET: ketamine; RISP: risperidone; SEM: standard error of the mean; VEH: vehicle.
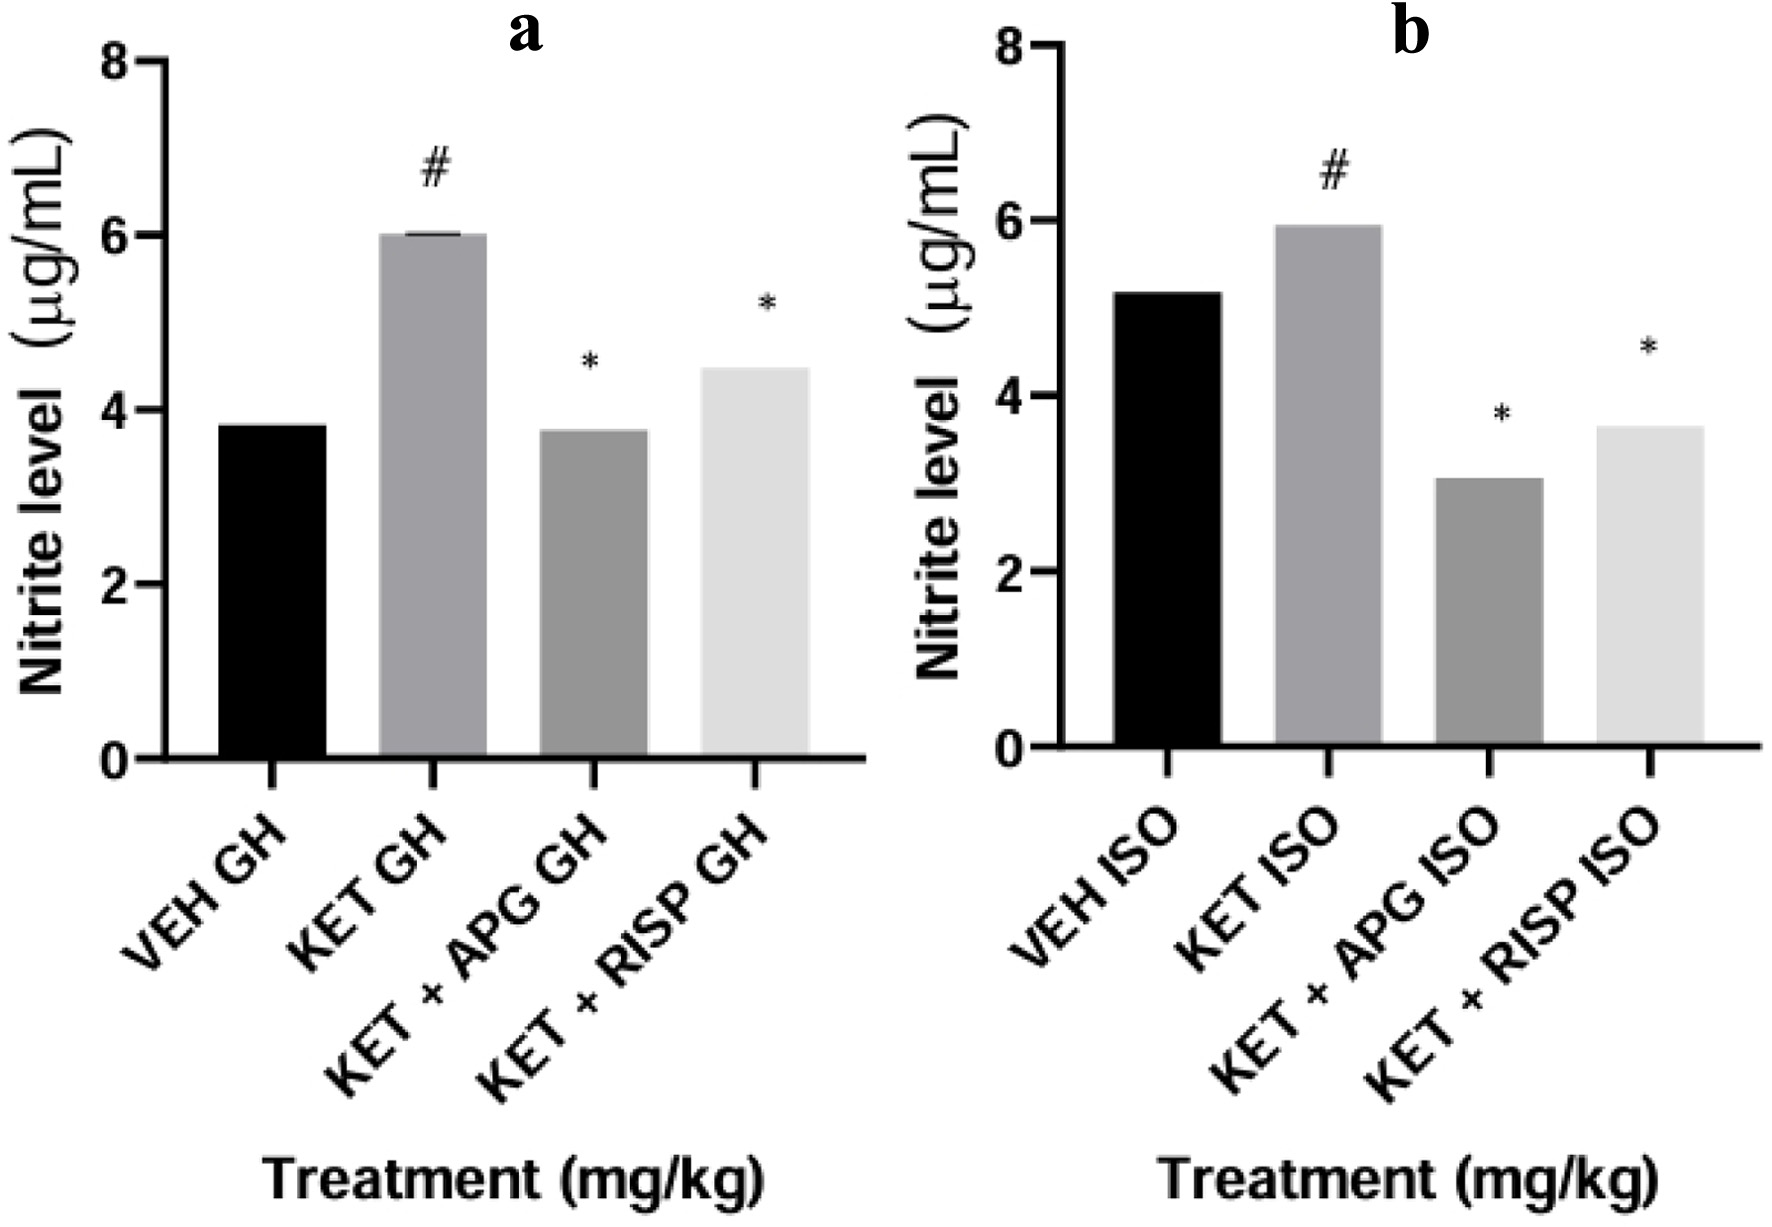
↓ Figure 14. Effect of APG on nitrite level in prefrontal cortex of weanling rats subjected to two-hit model of neurodevelopmental psychosis. (a) Group-housed animals. (b) Isolated-rearing animals. Bar represents the mean ± SEM of eight animals. *P < 0.05 as compared with KET GH/KET ISO followed by ANOVA and Tukey’s post hoc test for multiple comparisons. #P < 0.05 as compared with VEH GH/VEH ISO followed by ANOVA and Tukey’s post hoc test for multiple comparisons. APG: apigenin; ANOVA: analysis of variance; GH: group-housed; ISO: isolated; KET: ketamine; RISP: risperidone; SEM: standard error of the mean; VEH: vehicle.
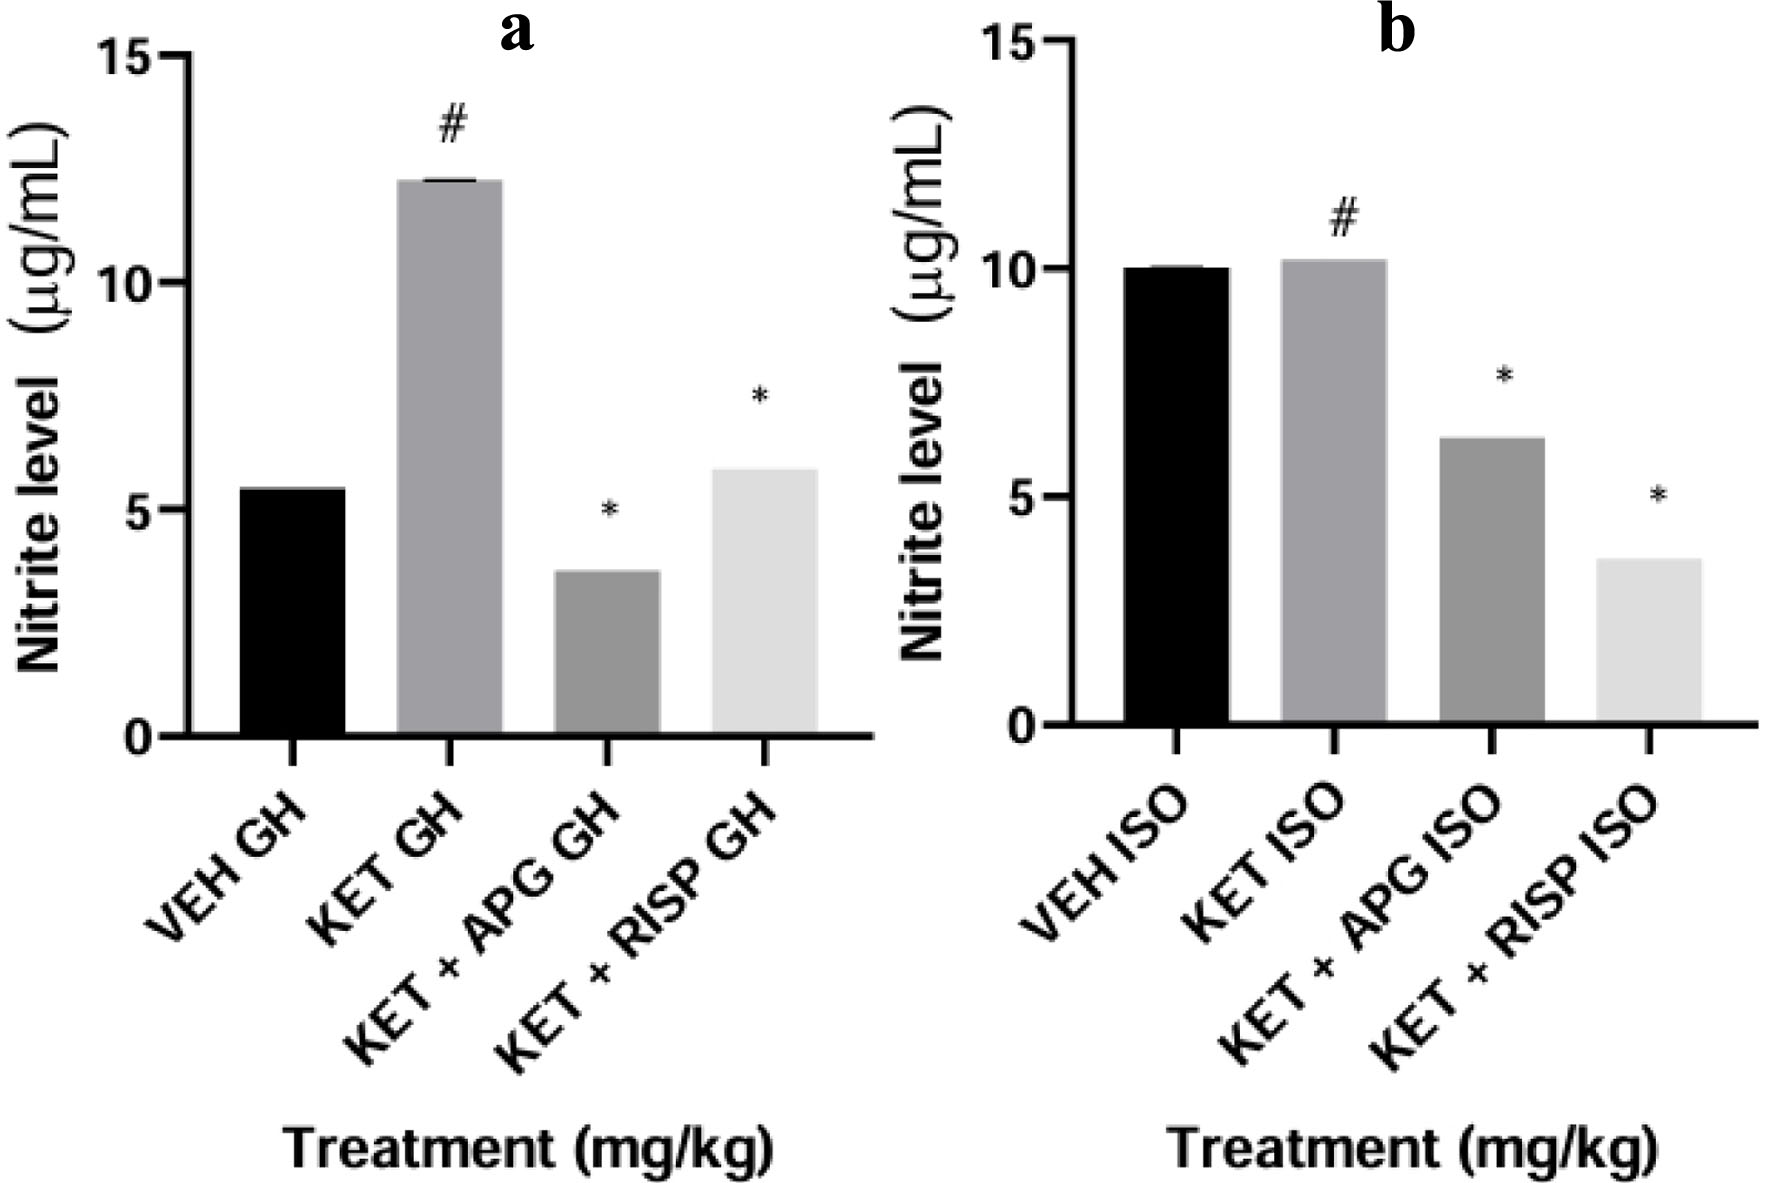
↓ Figure 15. Effect of APG on AChE activity on amygdala of weanling rats subjected to two-hit model of neurodevelopmental psychosis. (a) Group-housed animals. (b) Isolated-rearing animals. Bar represents the mean ± SEM of eight animals. *P < 0.05 as compared with KET GH/KET ISO followed by ANOVA and Tukey’s post hoc test for multiple comparisons. #P < 0.05 as compared with VEH GH/VEH ISO followed by ANOVA and Tukey’s post hoc test for multiple comparisons. AChE: acetylcholinesterase; APG: apigenin; ANOVA: analysis of variance; GH: group-housed; ISO: isolated; KET: ketamine; RISP: risperidone; SEM: standard error of the mean; VEH: vehicle.
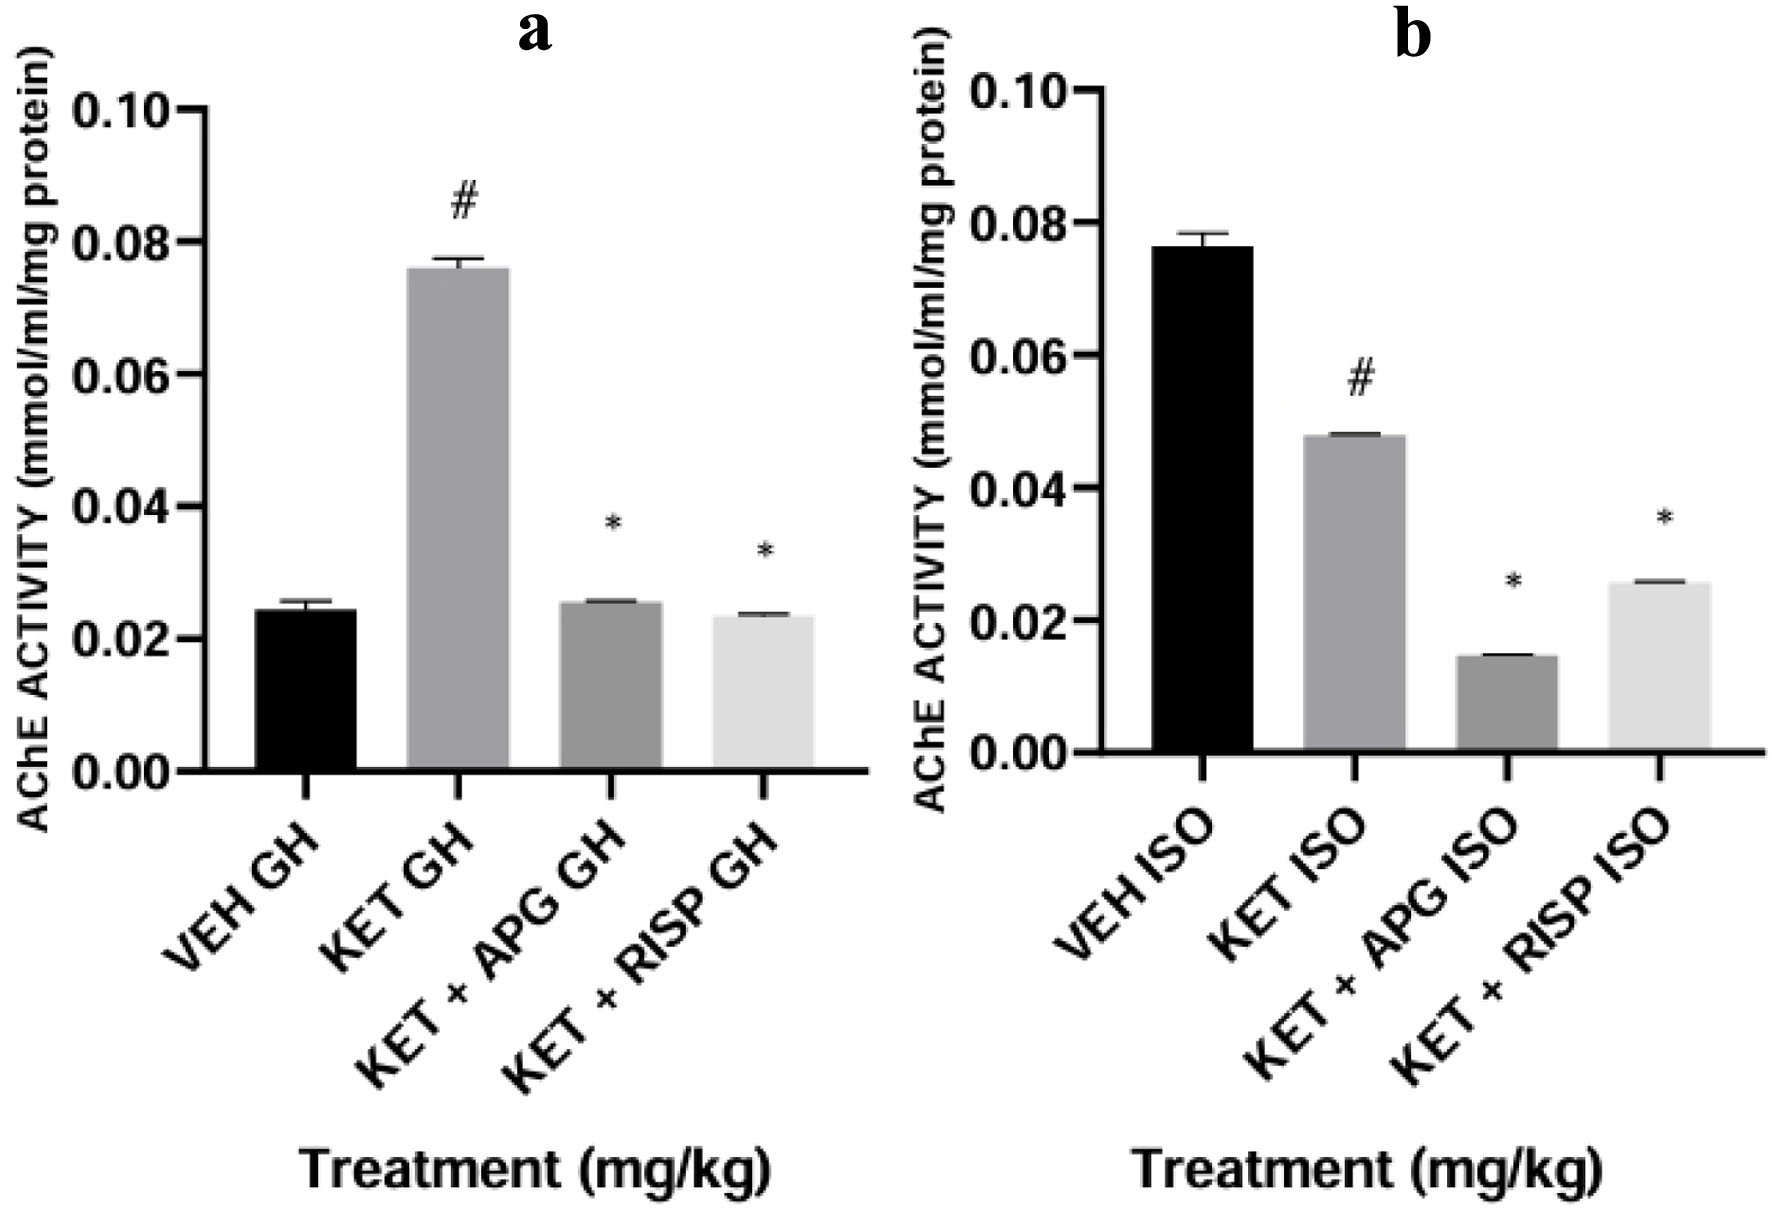
↓ Figure 16. Effect of APG on AChE activity on hippocampus of weanling rats subjected to two-hit model of neurodevelopmental psychosis. (a) Group-housed animals. (b) Isolated-rearing animals. Bar represents the mean ± SEM of eight animals. *P < 0.05 as compared with KET GH/KET ISO followed by ANOVA and Tukey’s post hoc test for multiple comparisons. #P < 0.05 as compared with VEH GH/VEH ISO followed by ANOVA and Tukey’s post hoc test for multiple comparisons. AChE: acetylcholinesterase; APG: apigenin; ANOVA: analysis of variance; GH: group-housed; ISO: isolated; KET: ketamine; RISP: risperidone; SEM: standard error of the mean; VEH: vehicle.
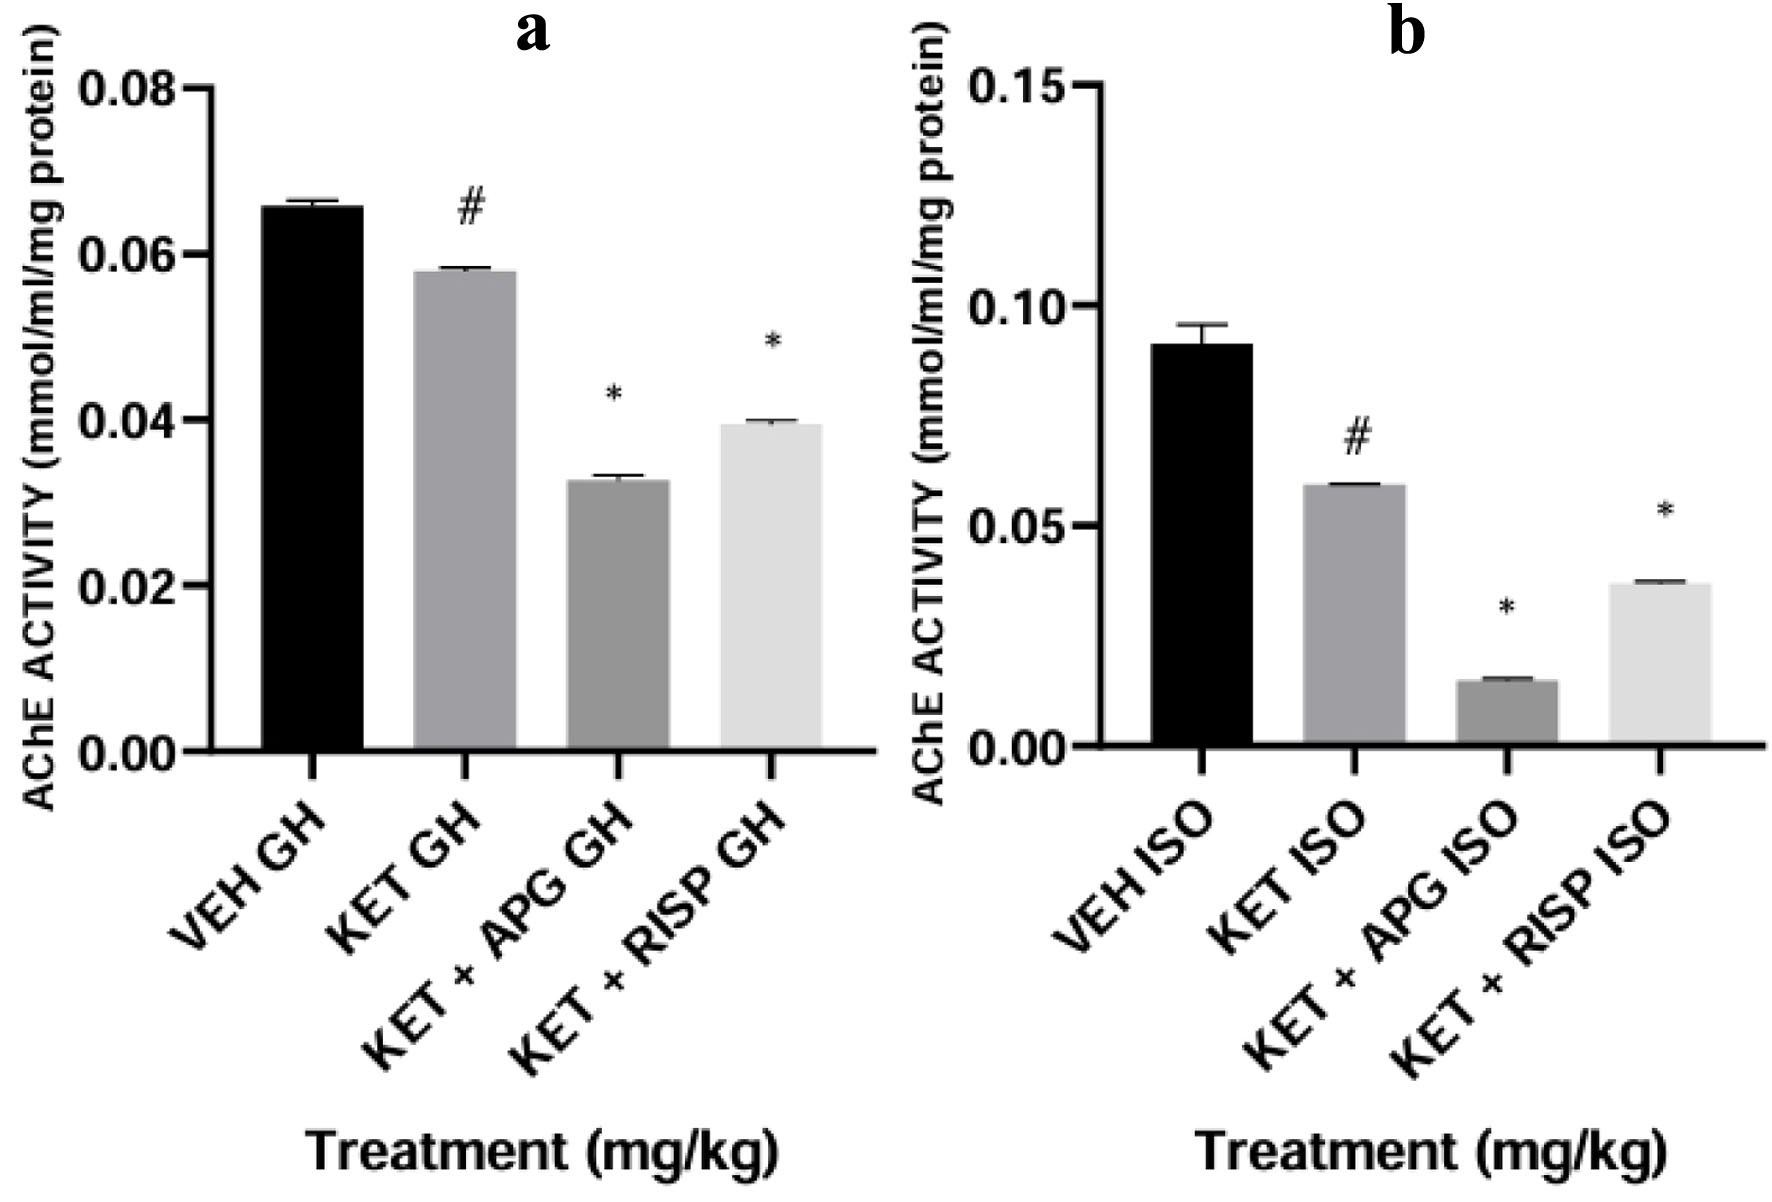
↓ Figure 17. Effect of APG on AChE activity on prefrontal cortex of weanling rats subjected to two-hit model of neurodevelopmental psychosis. (a) Group-housed animals. (b) Isolated-rearing animals. Bar represents the mean ± SEM of eight animals. *P < 0.05 as compared with KET GH/KET ISO followed by ANOVA and Tukey’s post hoc test for multiple comparisons. #P < 0.05 as compared with VEH GH/VEH ISO followed by ANOVA and Tukey’s post hoc test for multiple comparisons. AChE: acetylcholinesterase; APG: apigenin; ANOVA: analysis of variance; GH: group-housed; ISO: isolated; KET: ketamine; RISP: risperidone; SEM: standard error of the mean; VEH: vehicle.
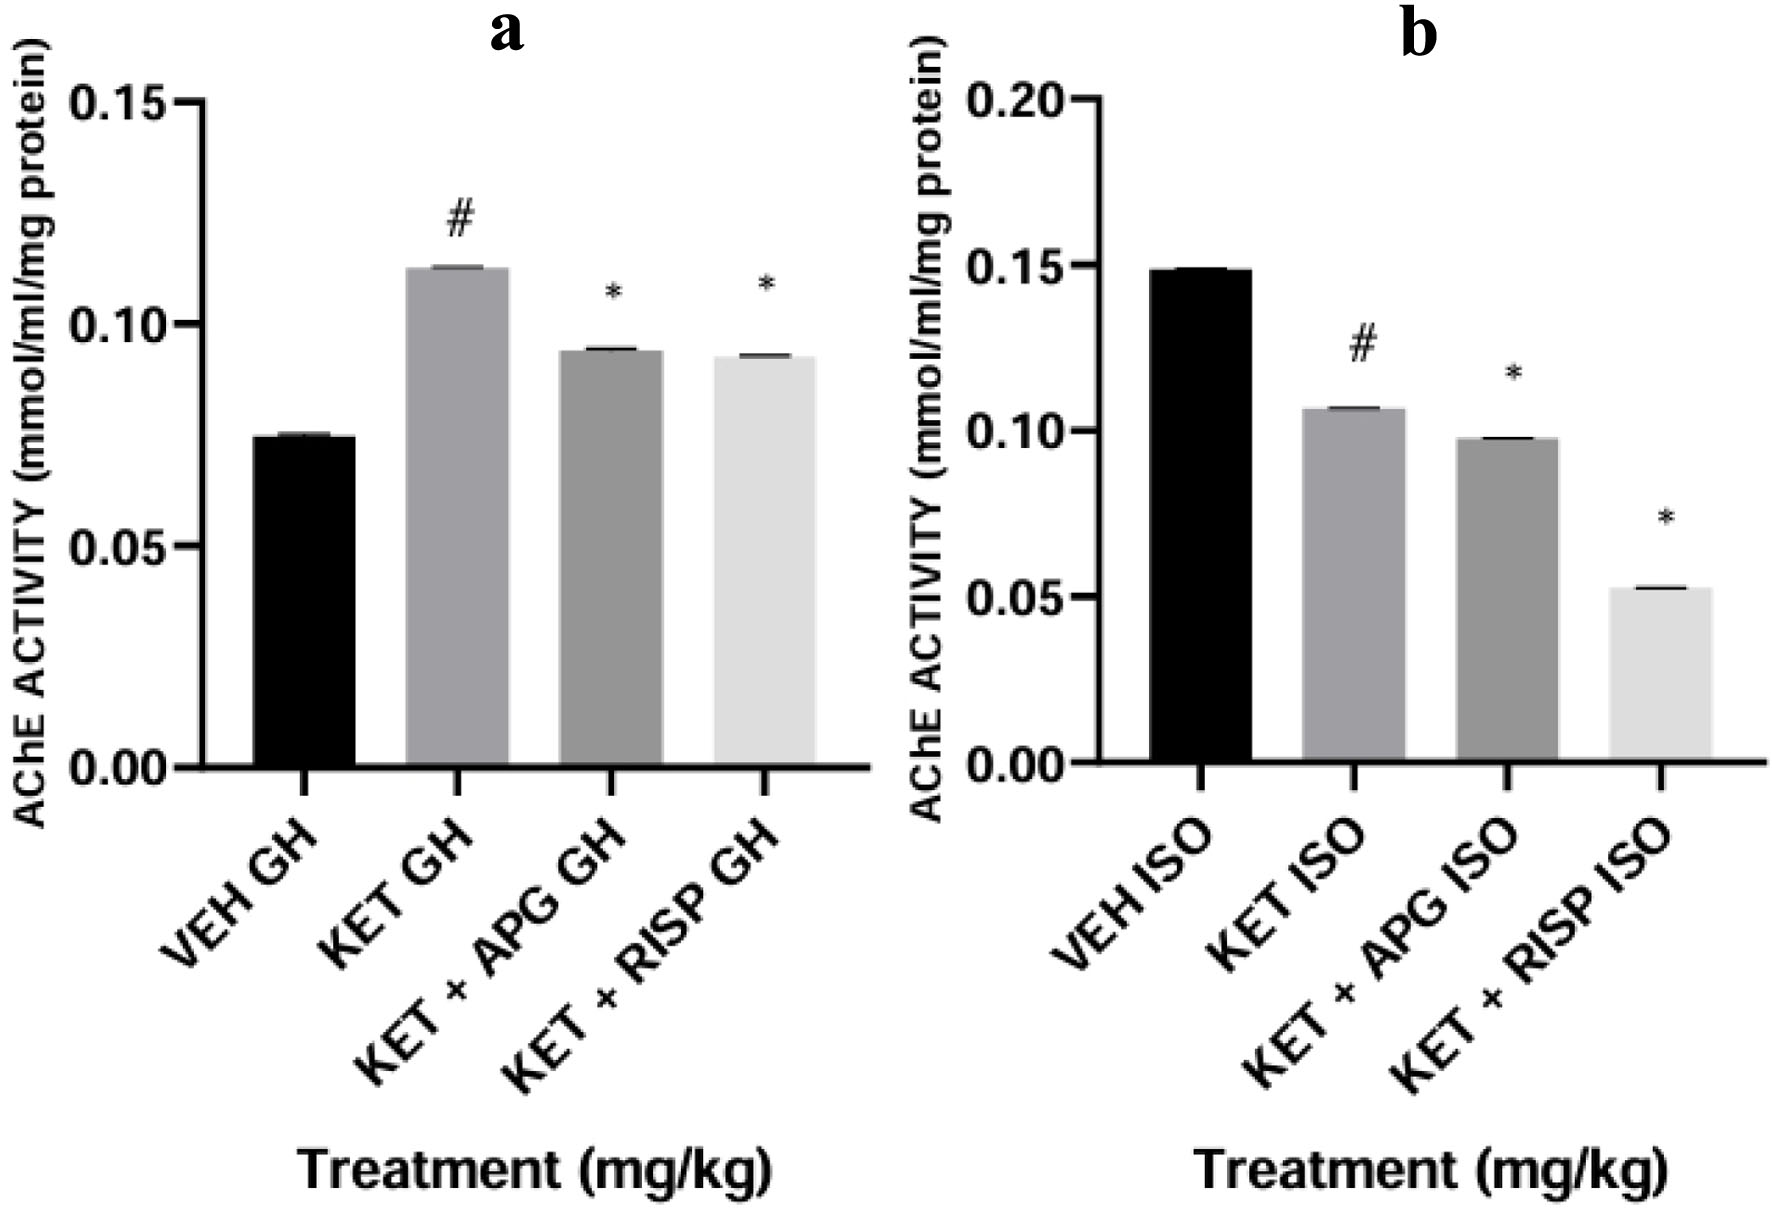
↓ Figure 18. Effect of APG on DA level in Amygdala of weanling rats subjected to two-hit model of neurodevelopmental psychosis. (a) Group-housed animals. (b) Isolated-rearing animals. Bar represents the mean ± SEM of eight animals. *P < 0.05 as compared with KET GH/KET ISO followed by ANOVA and Tukey’s post hoc test for multiple comparisons. #P < 0.05 as compared with VEH GH/VEH ISO followed by ANOVA and Tukey’s post hoc test for multiple comparisons. APG: apigenin; ANOVA: analysis of variance; DA: dopamine; GH: group-housed; ISO: isolated; KET: ketamine; RISP: risperidone; SEM: standard error of the mean; VEH: vehicle.
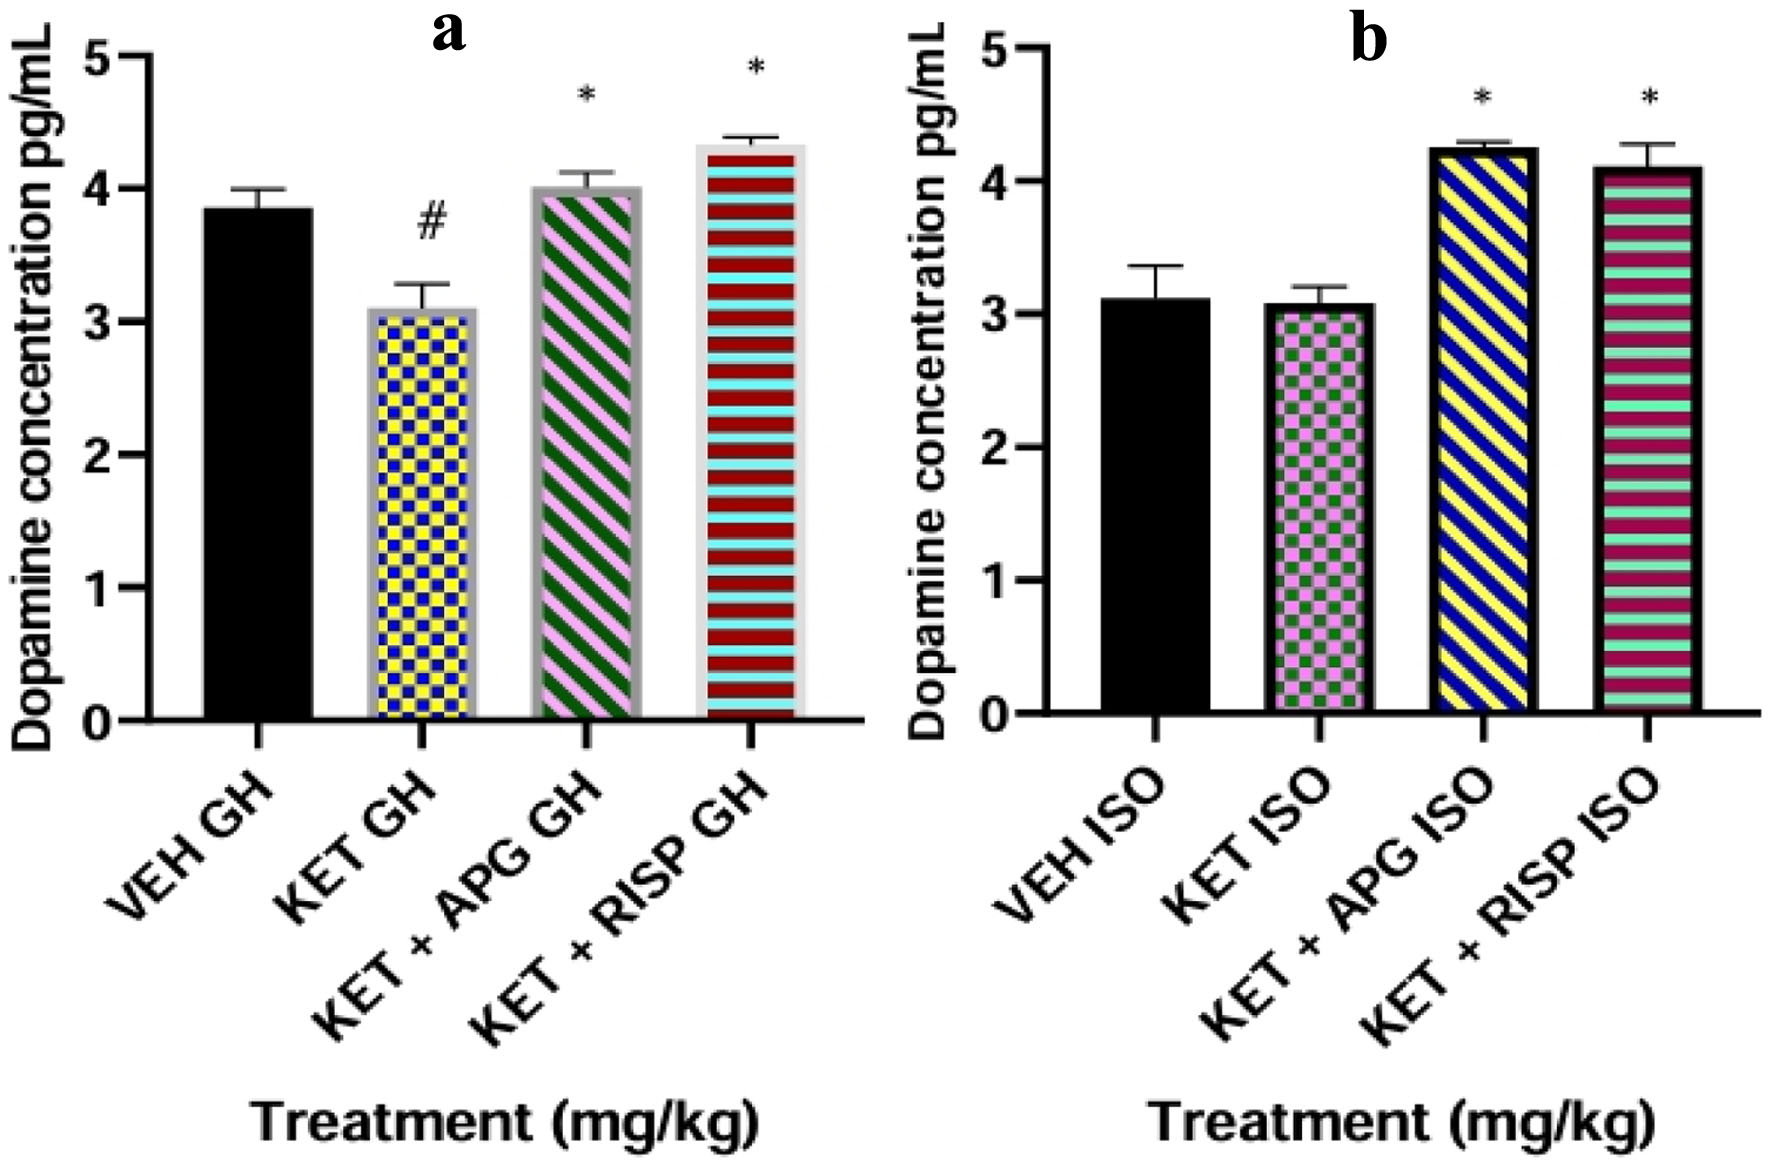
↓ Figure 19. Effect of APG on DA level in Hippocampus of weanling rats subjected to two-hit model of neurodevelopmental psychosis. (a) Group-housed animals. (b) Isolated-rearing animals. Bar represents the mean ± SEM of eight animals. *P < 0.05 as compared with KET GH/KET ISO followed by ANOVA and Tukey’s post hoc test for multiple comparisons. #P < 0.05 as compared with VEH GH/VEH ISO followed by ANOVA and Tukey’s post hoc test for multiple comparisons. APG: apigenin; ANOVA: analysis of variance; DA: dopamine; GH: group-housed; ISO: isolated; KET: ketamine; RISP: risperidone; SEM: standard error of the mean; VEH: vehicle.
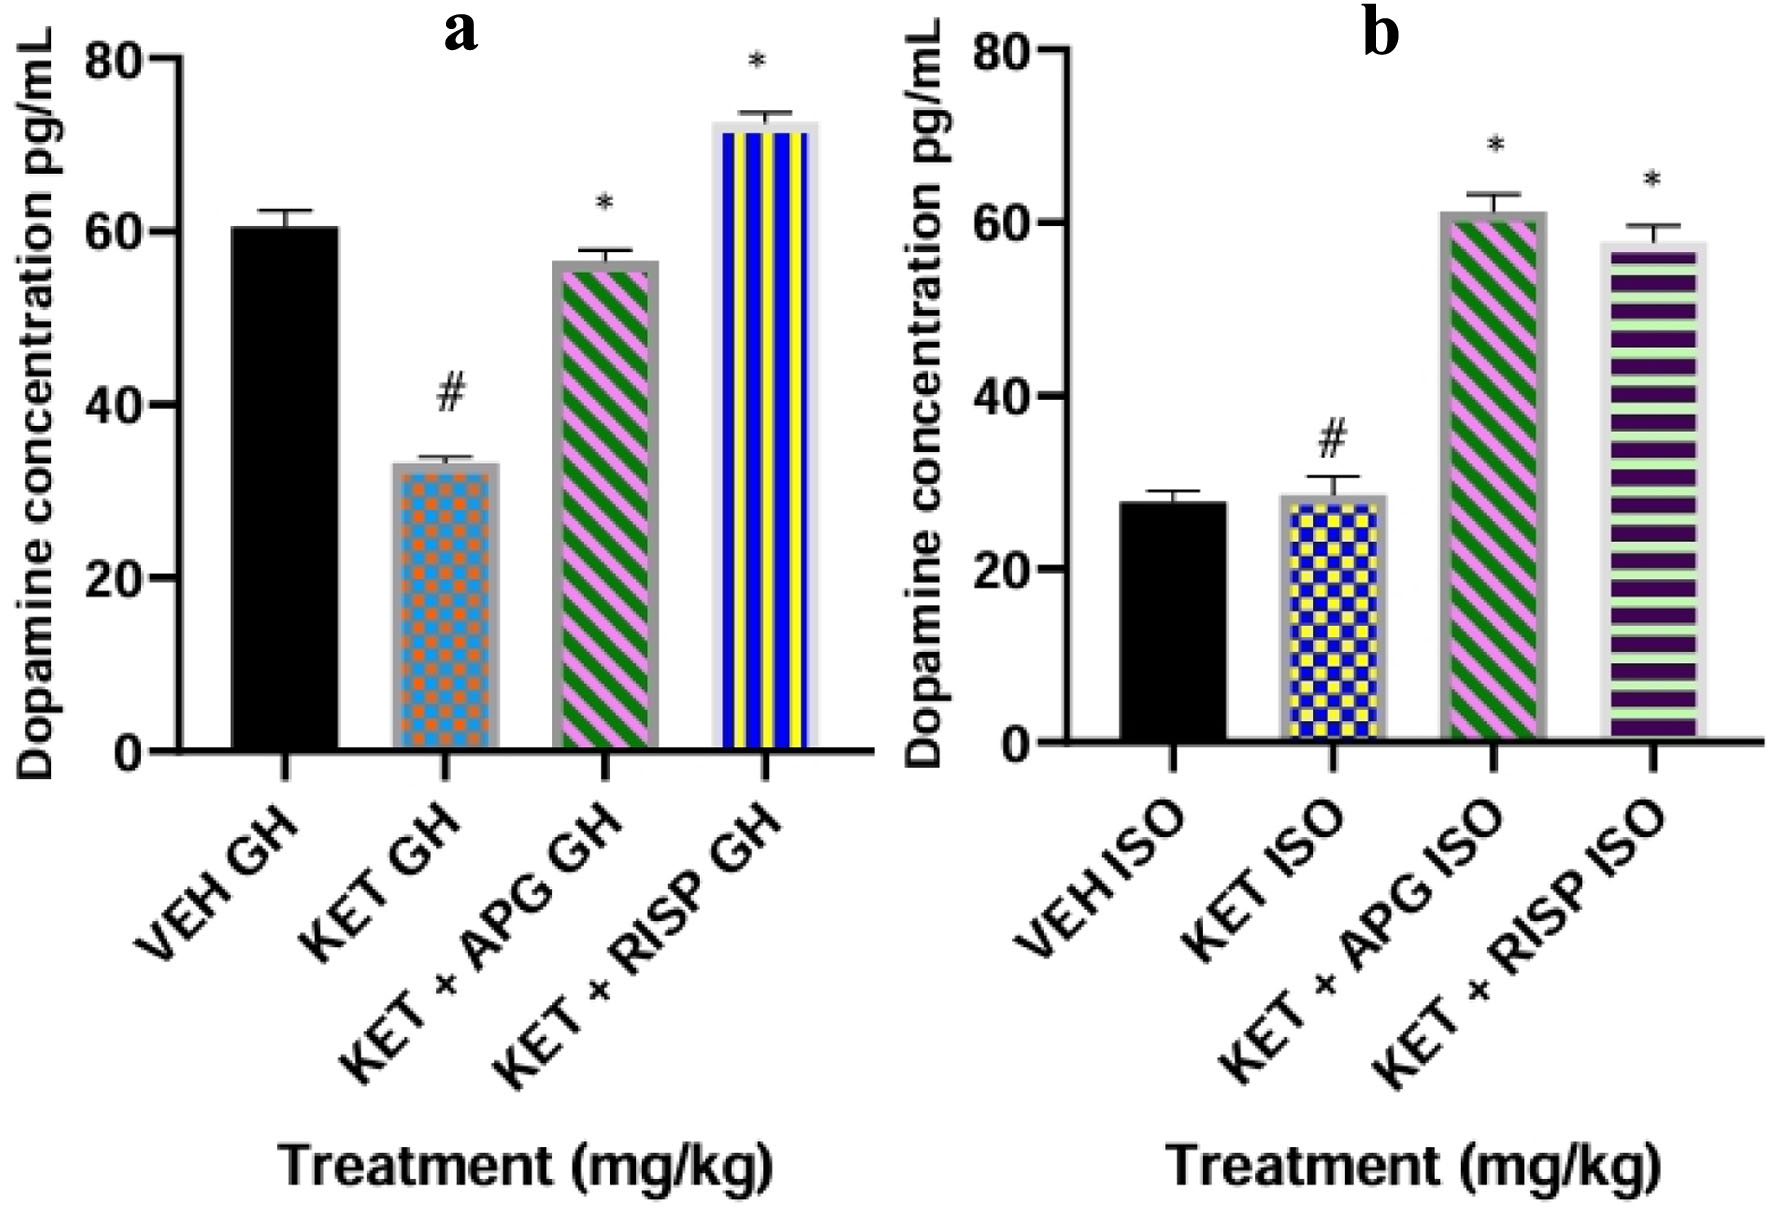
↓ Figure 20. Effect of APG on DA level in prefrontal cortex of weanling rats subjected to two-hit model of neurodevelopmental psychosis. (a) Group-housed animals. (b) Isolated-rearing animals. Bar represents the mean ± SEM of eight animals. *P < 0.05 as compared with KET GH/KET ISO followed by ANOVA and Tukey’s post hoc test for multiple comparisons. #P < 0.05 as compared with VEH GH/VEH ISO followed by ANOVA and Tukey’s post hoc test for multiple comparisons. APG: apigenin; ANOVA: analysis of variance; DA: dopamine; GH: group-housed; ISO: isolated; KET: ketamine; RISP: risperidone; SEM: standard error of the mean; VEH: vehicle.
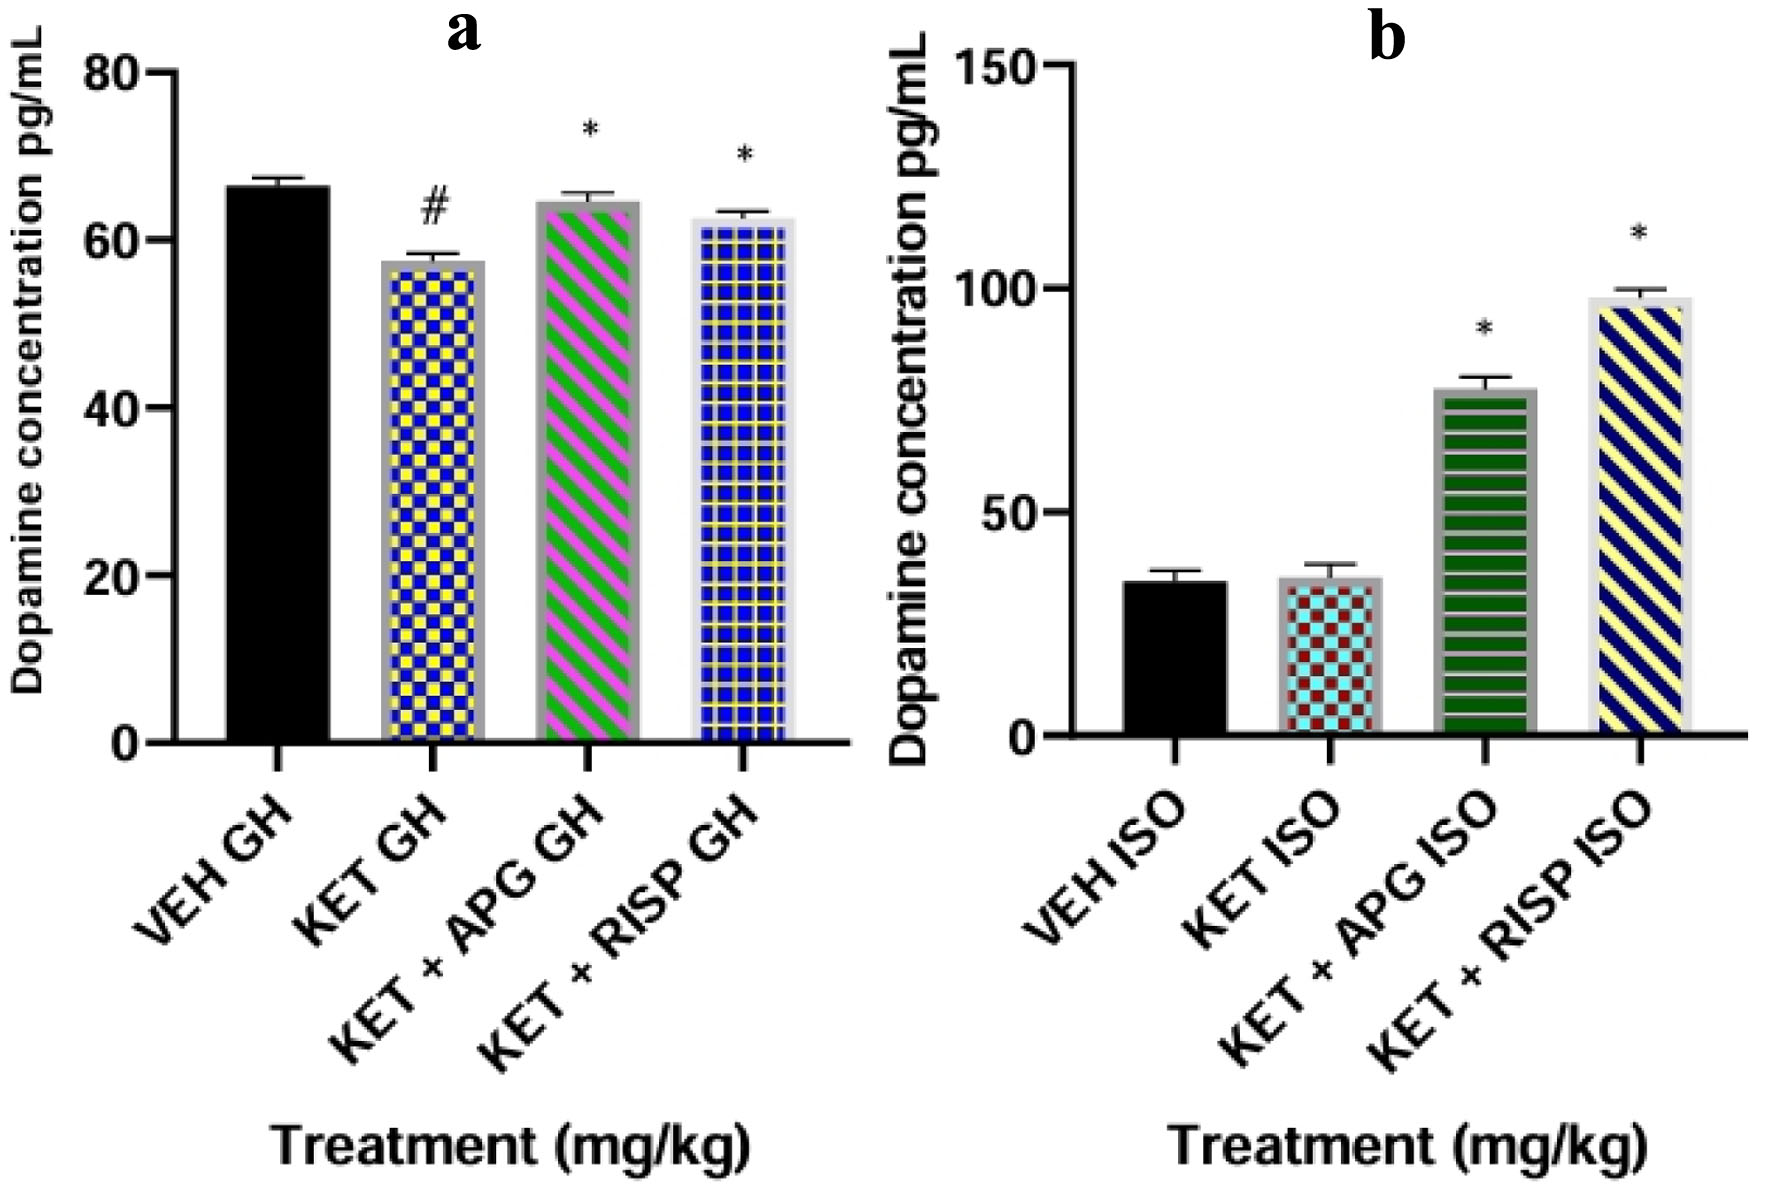
↓ Figure 21. Photomicrographs of amygdala showing surviving neurons in weanling rats subjected to two-hit model of neurodevelopmental psychosis. (a) Group-housed animals. (b) Isolated-rearing animals. APG: apigenin; DN: degenerating neurons; GH: group housed; ISO: isolated; K: karyopyknosis; KET: ketamine; P: pyknosis; RISP: risperidone; VC: vacoulated cytoplasm; VEH: vehicle.
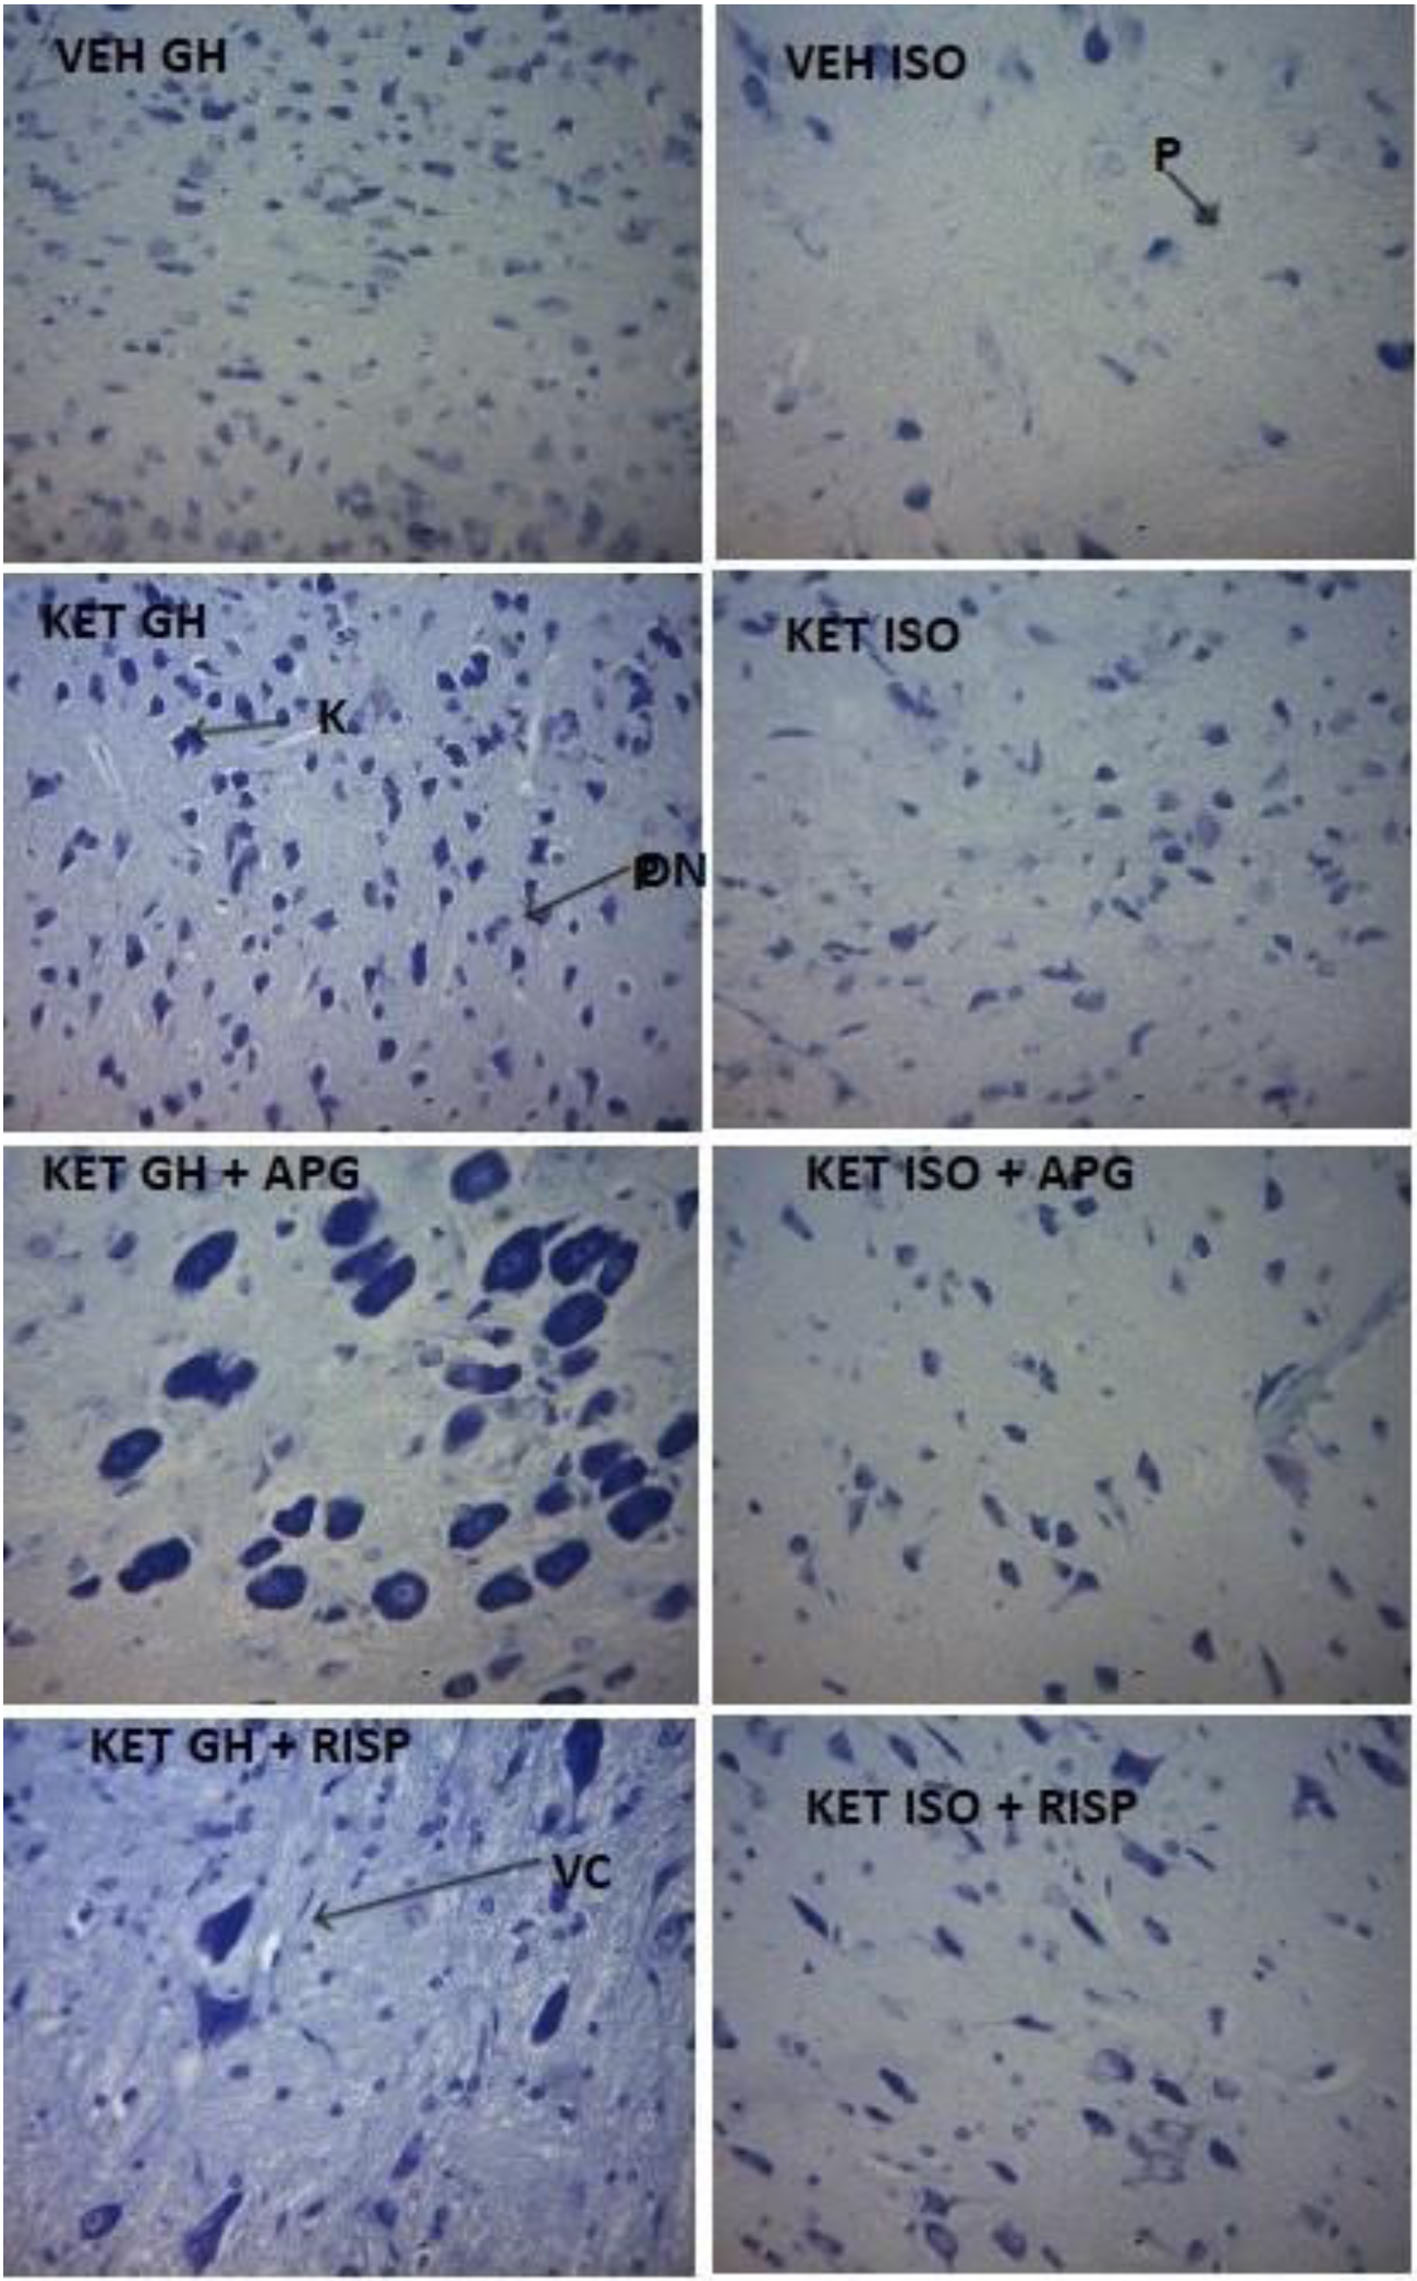
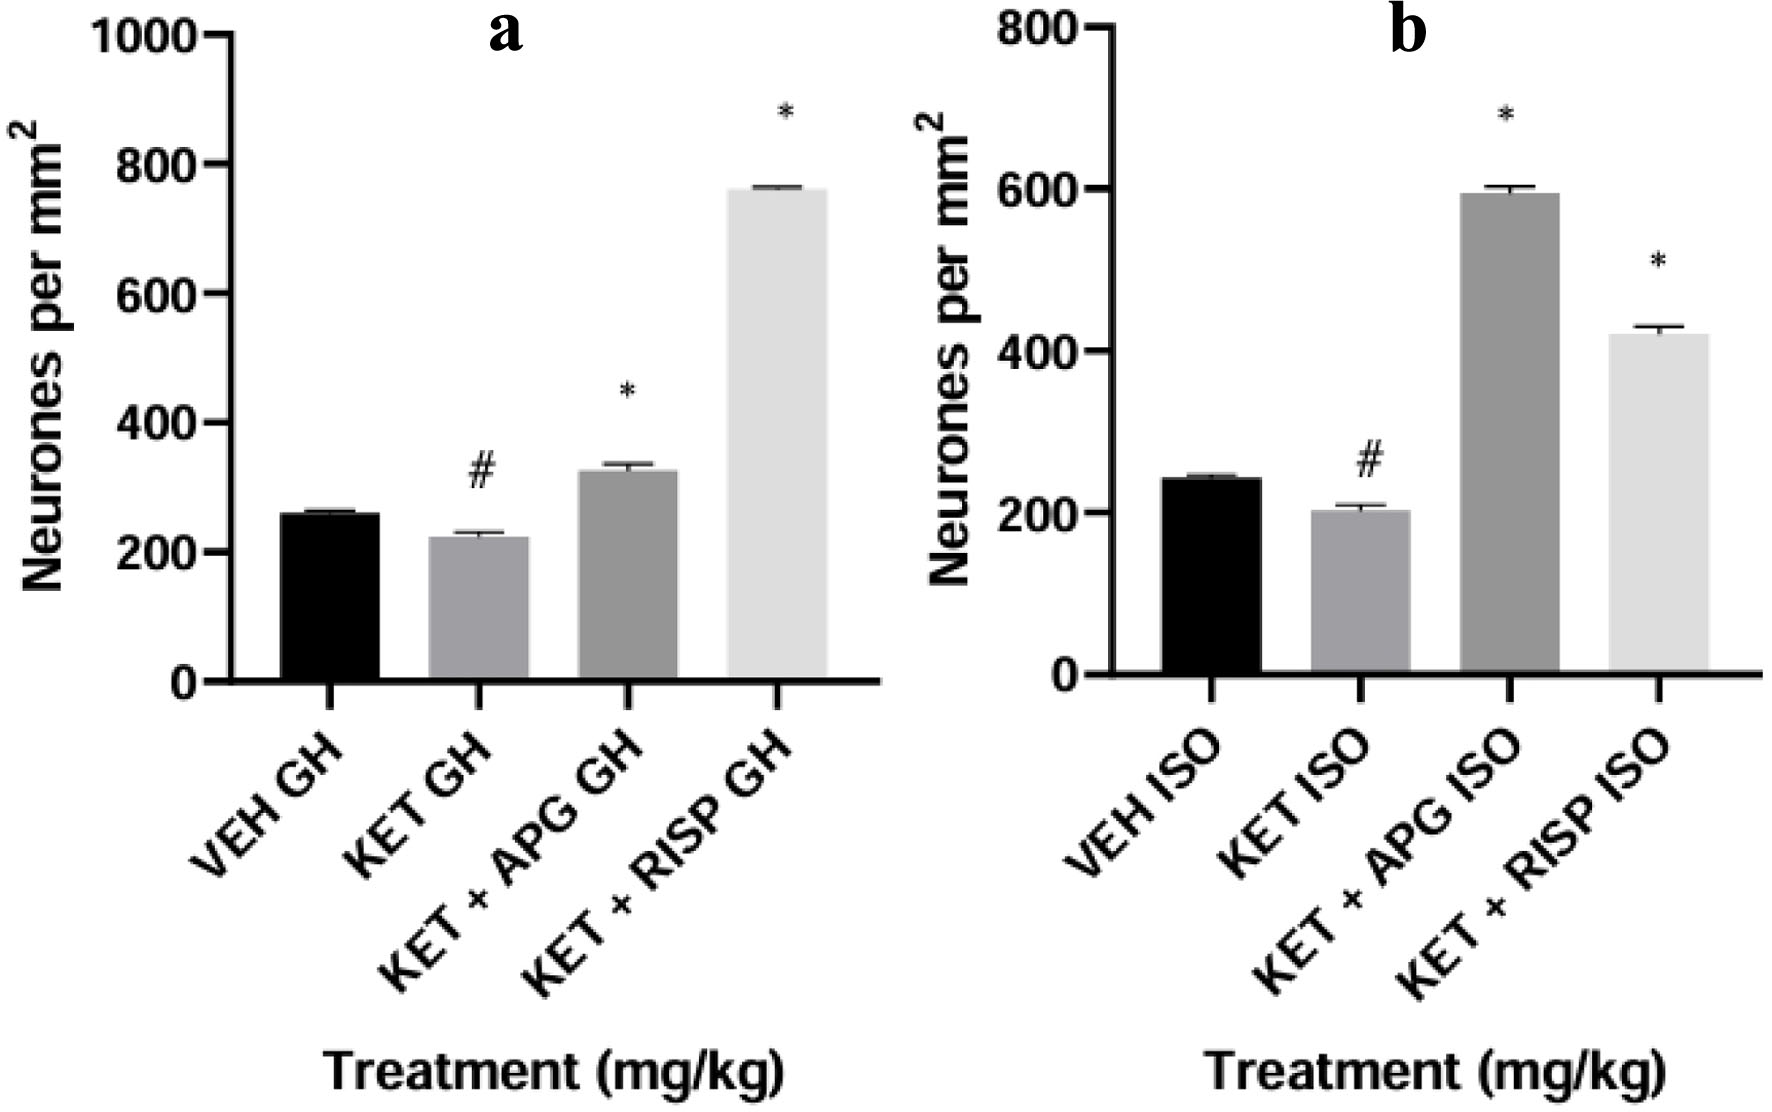
↓ Figure 22. Neuronal density in amygdala of weanling rats subjected to two-hit model of neurodevelopmental psychosis. (a) Group-housed animals. (b) Isolated-rearing animals. Bar represents the mean ± SEM of eight animals. *P < 0.05 as compared with KET GH/KET ISO followed by ANOVA and Tukey’s post hoc test for multiple comparisons. #P < 0.05 as compared with VEH GH/VEH ISO followed by ANOVA and Tukey’s post hoc test for multiple comparisons. APG: apigenin; ANOVA: analysis of variance; GH: group-housed; ISO: isolated; KET: ketamine; RISP: risperidone; SEM: standard error of the mean; VEH: vehicle.
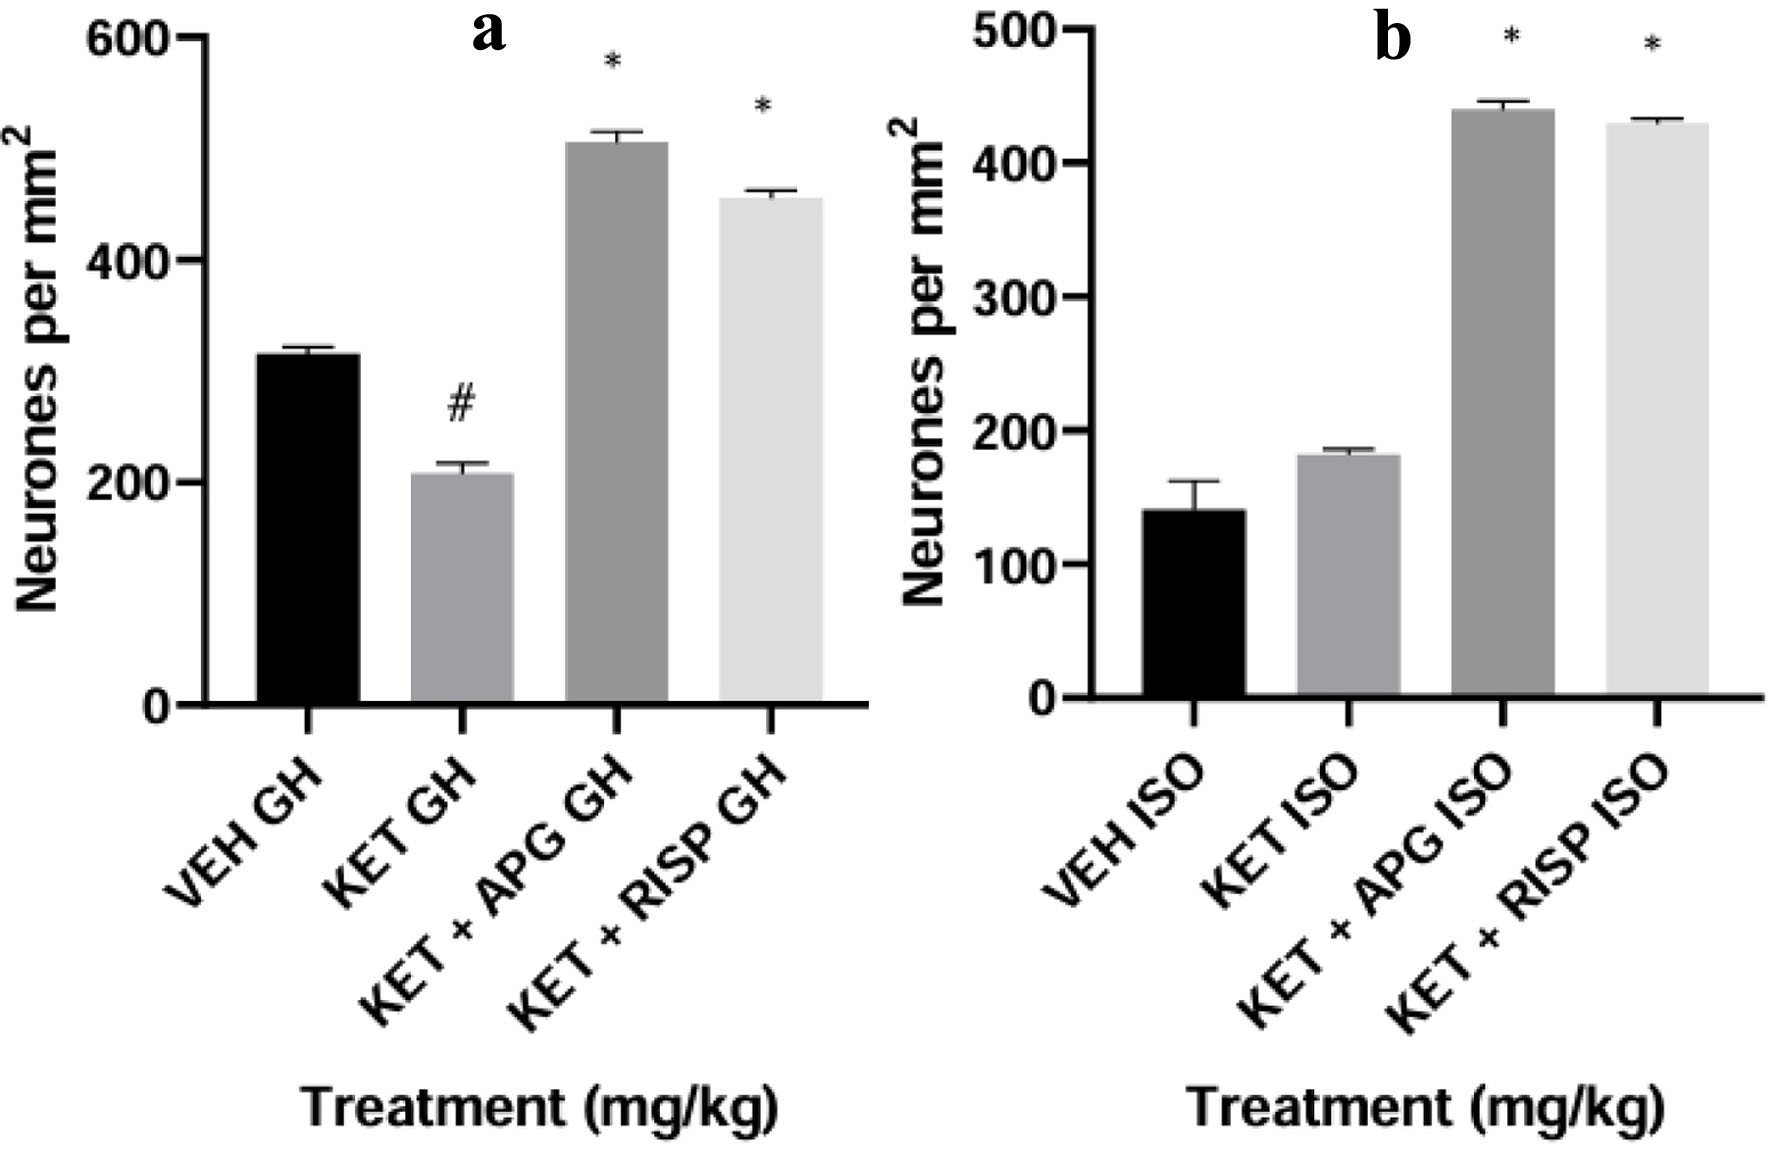
↓ Figure 23. Photomicrographs of hippocampus showing surviving neurons in weanling rats subjected to two-hit model of neurodevelopmental psychosis. APG: apigenin; DN: degenerating neurons; GH: group housed; ISO: isolated; K: karyopyknosis; KET: ketamine; P: pyknosis; RISP: risperidone; VC: vacoulated cytoplasm; VEH: vehicle.
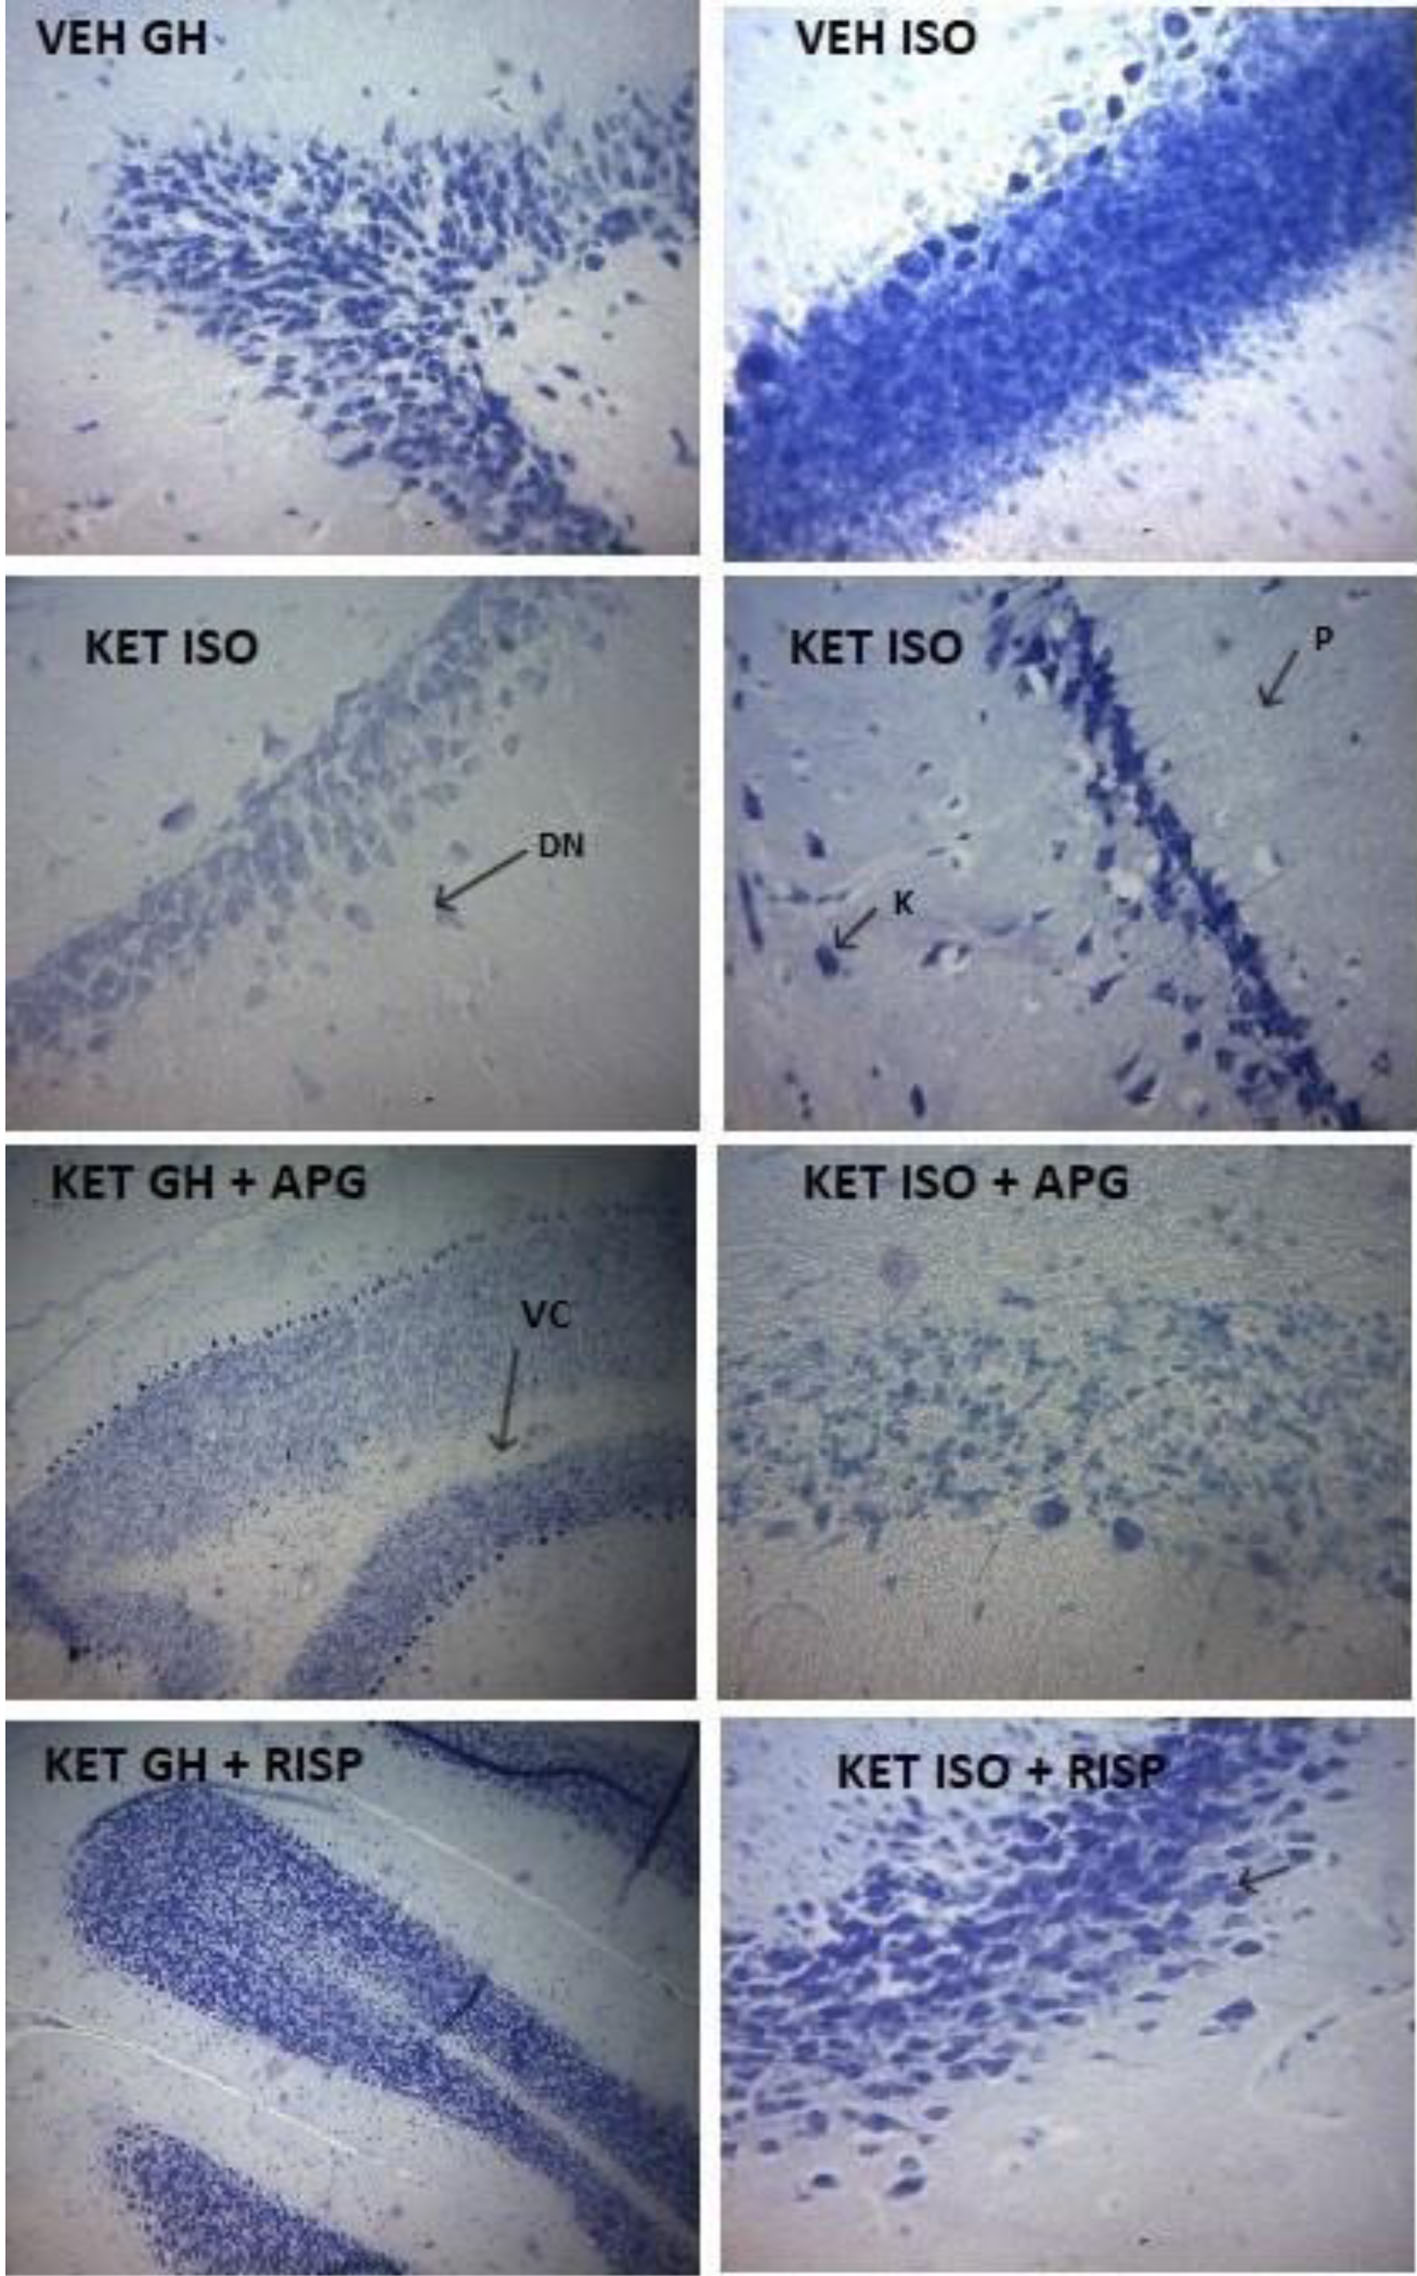
↓ Figure 24. Neuronal density in hippocampus of weanling rats subjected to Two-Hit model of neurodevelopmental psychosis. (a) Group-housed animals. (b) Isolated-rearing animals. Bar represents the mean ± SEM of eight animals. *P < 0.05 as compared with KET GH/KET ISO followed by ANOVA and Tukey’s post hoc test for multiple comparisons. #P < 0.05 as compared with VEH GH/VEH ISO followed by ANOVA and Tukey’s post hoc test for multiple comparisons. APG: apigenin; ANOVA: analysis of variance; GH: group-housed; ISO: isolated; KET: ketamine; RISP: risperidone; SEM: standard error of the mean; VEH: vehicle.
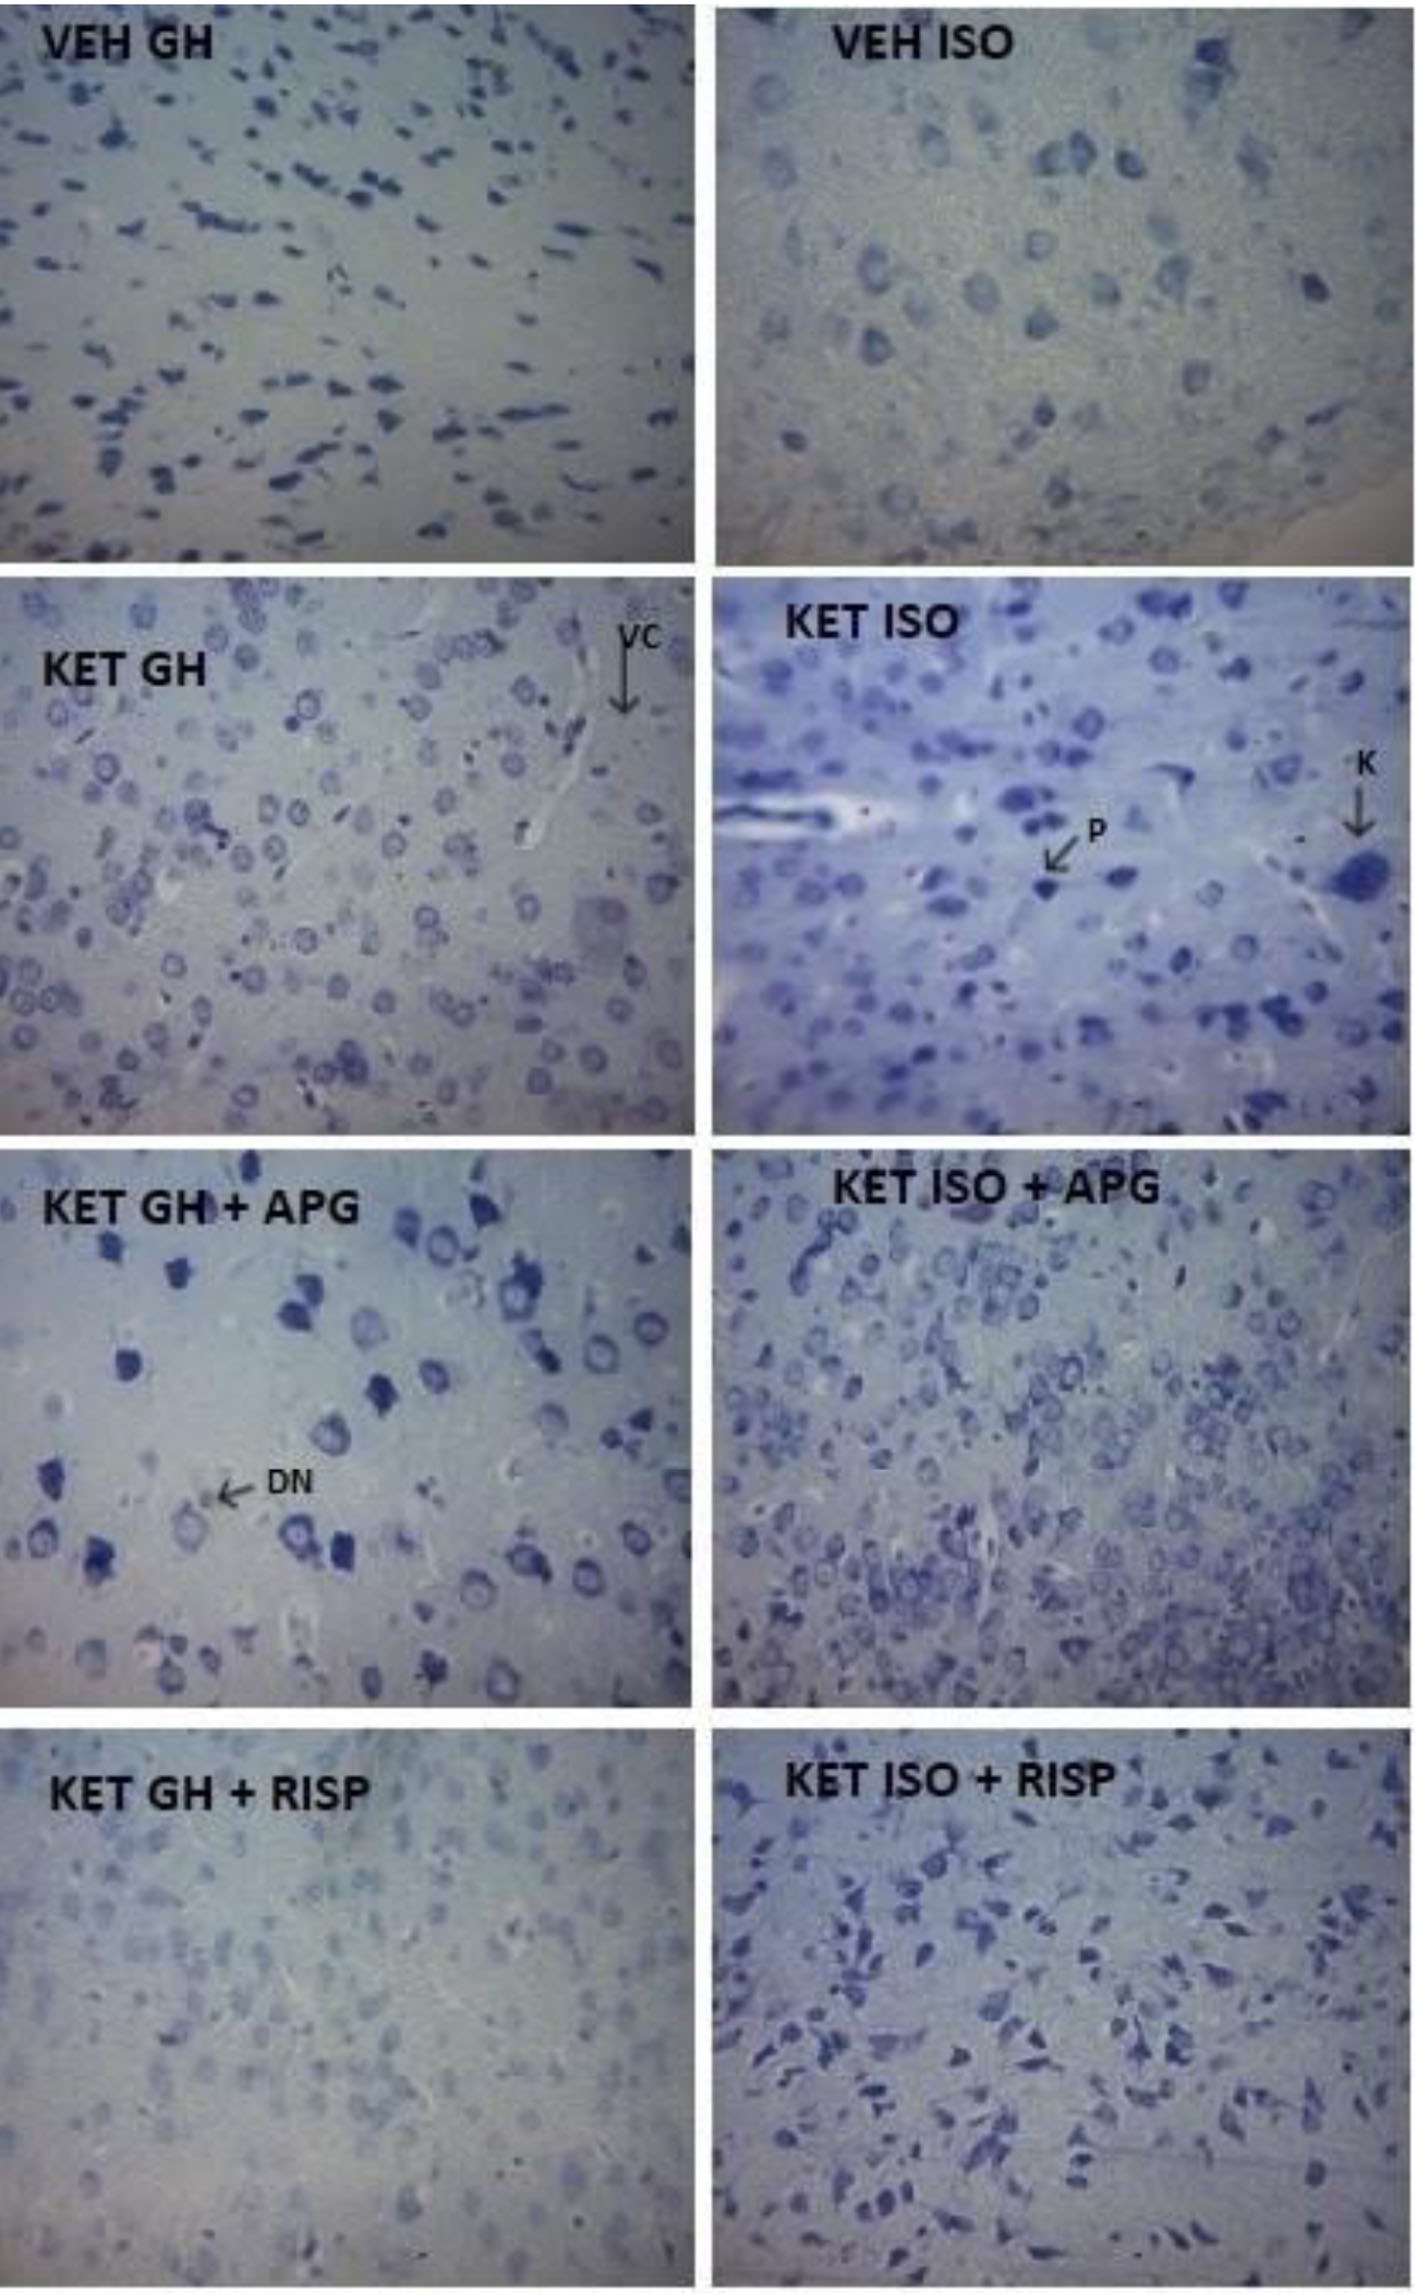
↓ Figure 25. Photomicrographs of prefrontal cortex showing surviving neurons in weanling rats subjected to two-hit model of neurodevelopmental psychosis. APG: apigenin; DN: degenerating neurons; GH: group housed; ISO: isolated; K: karyopyknosis; KET: ketamine; P: pyknosis; RISP: risperidone; VC: vacoulated cytoplasm; VEH: vehicle.
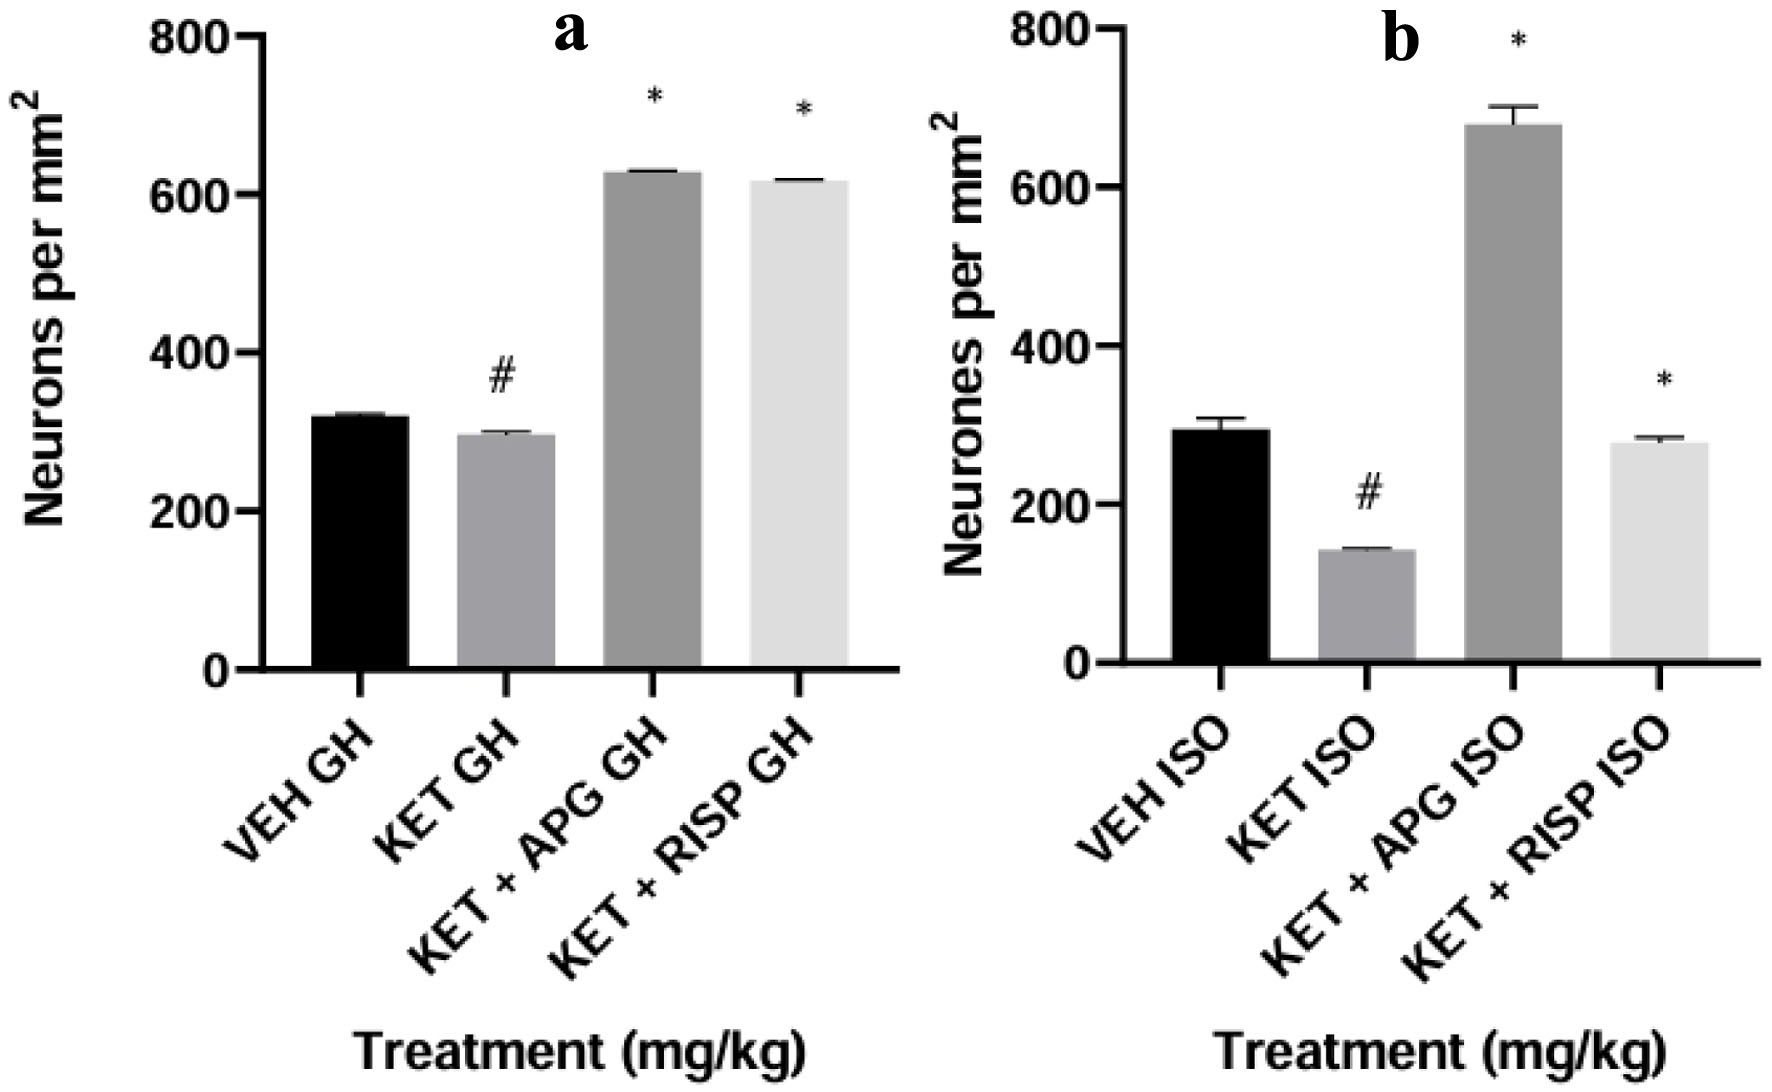
↓ Figure 26. Neuronal density in prefrontal cortex of weanling rats subjected to two-hit model of neurodevelopmental psychosis. (a) Group-housed animals. (b) Isolated-rearing animals. Bar represents the mean ± SEM of eight animals. *P < 0.05 as compared with KET GH/KET ISO followed by ANOVA and Tukey’s post hoc test for multiple comparisons. #P < 0.05 as compared with VEH GH/VEH ISO followed by ANOVA and Tukey’s post hoc test for multiple comparisons. APG: apigenin; ANOVA: analysis of variance; GH: group-housed; ISO: isolated; KET: ketamine; RISP: risperidone; SEM: standard error of the mean; VEH: vehicle.